The Skeleton in the Closet

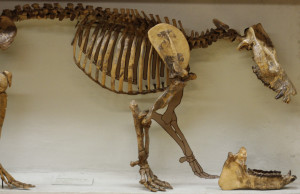
IMG_1618

After a few ups and downs, everything you always wanted to know about the effect of missing data on recovering topology using a Total Evidence approach is now available online (Open Access)!

This paper also treats many different questions that people might be interested in (Bayesian vs. ML; how to compare tree topologies; comparing entire distributions, not only their means and variance; and many more!) but I’ll leave it to you to discover it…

Back on track, more than one an a half CPU centuries of calculation ago, Natalie and myself wanted to build a Total Evidence tip-dated primates tree. The Total Evidence method is the method that allows you to combine both living and fossil species (or actually, read “both molecular and morphological data”) into the same phylogenies. The tip-dating method, is an additional method that uses the age of the tips rather than the age of the nodes for dating such a tree. But I’m not going to talk about that in this post.

At the start of the project, we were both confident about the idea behind it and that primates would be the ideal group for such work since they are so well studied. A study that I described in a former post also came out around the same time, encouraging us and comforting us in this project.

However, as you might guess, something went wrong, horribly wrong! For the Total Evidence method, we need molecular data for living species (check) morphological data for fossils species (check) and also for living species (che… No, wait)! After looking at the available data, we quickly found out that there was a crucial lack of living taxa with available morphological data (check our preprint to be submitted to Biology Letters putting the actual numbers on the problem). From that problem, rose the idea of actually testing how that would influence our analysis. And funnily enough, this problem become one of the two major parts of my PhD!

Running thorough (and loooooong) simulations, we assessed the impact of missing data on topology when using a Total Evidence method. We looked at three parameters where data would be missing:

  1. The first one, was obviously the one I introduced above: the number of living taxa with no available morphological data (at all!).
  2. The second one, was the amount of available data in the fossil record (because yes, fossils can be a bit patchy).
  3. And the third one, the overall amount of morphological characters.


We then compared the effect of different levels of available data for each parameter individually and and their combination on recovering the correct topology, using both Maximum Likelihood and Bayesian Inference. For the correct topology, we used the tree that had no missing data in our simulations. For each parameter combination, we measured the clades in common between the correct topology and the trees with missing data as well as the placement of wild-card taxa (typically fossils jumping everywhere).

Unsurprisingly, we found that the number of living taxa with no available morphological data was the most important parameter for recovering a good topology. In fact, once you go past 50% living taxa with no morphological data, the two other parameters have no effect at all, even if you have a perfect or a really bad fossil record or many or really few characters. This is kind of intuitive when you think about it because the only way to branch the fossils to living taxa is to use the morphological data. Therefore, if there are no morphological data for the living taxa, the fossils cannot branch with them regardless of the quality of the data. Therefore, in this paper, we argue that to improve our topologies in Total Evidence, we should visit more Natural History museums. And not only the exciting fossil collections but the well curated collections of living species as well!

All the code for this paper is available on GitHub.

Check out the latest presentation about both papers.

Paper 1: Guillerme & Cooper 2015 – Effects of missing data on topological inference using a Total Evidence approach – Molecular Phylogenetic and Evolution (doi:10.1016/j.ympev.2015.08.023).

Paper 2 (preprint):  Guillerme & Cooper 2015 – Assessment of cladistic data availability for living mammals – bioRxiv ().


Author: Thomas Guillerme, guillert[at]tcd.ie, @TGuillerme

Photo credit: Thomas Guillerme (AMNH collections)
The more the better?

birds-of-paradise

These days I’m writing up the discussion of my sensitivity analysis paper on missing data using the Total Evidence method (more about it here and here). One evident opening for proposing future improvement on my analysis is the obvious “let’s-do-it-again-with-more-data” one… But a recent Science paper by Jarvis et al made me reconsider that. Is more the always better?

Jarvis and his numerous colleagues just published one of the biggest bird phylogenies that contrasts with the previous reference one (by Jetz et al in Nature). In Jetz’s paper, the authors were interested in the relations among modern birds (read “non-dinosaurs ones”) and tackled the question by trying to sample the whole of bird biodiversity (9,993 species!). However, as in most analyses of this kind, the molecular data can be fairly poor (note that they still managed to collect a maximum of 15 genes for 6663 species). Even though the global picture of avian diversity is clear, some regions are less resolved than others and an obvious way to fix that would be to sample more genes per species. And that is, in a way, exactly what Jarvis and his colleagues tried to achieve.

In this new study, the authors went on sampling not 15, 70 or 150 genes but 8251 genes per species! This led to a really deep and long analysis – over 400 CPU years, and I thought 150 was long! – of the complete genome of birds. By the way, they use the name Total Evidence nucleotide tree (TENT) to design the results of their analysis which is pretty confusing since a total evidence tree means something quite different to me. But that’s just a semantic rant. Using this massive TENT, the authors fixed some previously poorly resolved nodes, redefined the names of ancient divergences among birds (with the Passerea – tits and relatives – and the Columbea – pigeons and relatives), demonstrated an explosive (“big-bang”) radiation after the K-T event and determined the patterns of certain traits evolution (such as raptoriality or vocal learning). In short a thorough work that allowed the authors to say: “The conflict we observe with other data types can no longer be considered to be due to error from smaller amounts of sequence data”. I feel that writing something like that in a paper is a nice achievement!

However – don’t get me wrong, this paper is yet a great example of collaborative work and insight in new methods – the sample size is… 45 species. In other words, Jetz et. al sampled 100% of the species but less than 1% of the data as for Jarvis et al., they sampled 100% of the data for less than 1% of the species. In this case, we have two extreme views of the same question (“how did avian diversity evolve?”) and in both cases, I think the macroevolutionary claims are weakened by the number of species or the amount of data… However, from a practical point of view, I think the method that included more species will be preferred by researchers since their species of interest are more likely to be present in that tree. What’s the best balance? Full genome or full sampling? I’ll leave it to you to decide…

Author

Thomas Guillerme, guillert[at]tcd.ie, @Tguillerme

Photo credit

http://everythingbirdsonline.com/

A brave new world of monkeying around with trees

Tamarin_portrait_2_edit3

I’ve spent the last few days writing an introduction for my first PhD paper on the practical issues of adding fossils to molecular phylogenies (full recipe here). This is my starting point: most people working in macroevolution agree that we should integrate fossils into modern phylogenetic trees. Of the many possible methods that are available, Ronquist’s total evidence method looks to be the most promising (however, some nice other ones also exist).

Recently Schrago et al. published a nice attempt to use this method on the Plathyrrini (New-World monkeys to you and me):

As a reminder, the aim of this total evidence method is to combine all of the available data: both molecular and morphological. Traditionally, analyses have treated each type of data separately; approaches which bring their own advantages and problems.

Let’s start with the molecules:

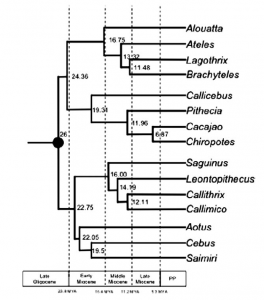
Opazo et al. published in 2006 a classical example of a molecular phylogenetics study. There are more recent, impressive phylogenetic studies (like Perelman et al. in 2011 and Springer et al. in 2012) on most of the primates and using more genetic data but I think Opazo is a better example of a traditional approach because it involves a tree with 17 taxa instead of more than 200.

Opazo.et.al~2006-Fig5
Opazo et al. 2006 Fig. 5. A Platyrrhini dated phylogeny – values indicate the age of the nodes, the circle at the root of the tree is the fossil used for age calibration: Branisella.

Two of the main advantages of this approach are the quantity of data involved (tens of thousands base pairs) and the methods of inferring the evolutionary history: molecular evolutionary models are easy to understand and easy to implement (each site has a finite number of states – A, C, G, T or nothing – and probabilistic models are good enough to infer the rate of changes from one state to the other). From a data perspective, another  practical advantage is that, with modern NextGen sequencing, it’s really easy and fast to obtain a full genomic dataset. However, the main inconvenience from a macroevolutionary point of view is that molecular approaches don’t really take evidence from the fossil record into account. In the Opazo example, the only fossil used is Branisella, and the only useful information here is just its age (around 26 Ma) used to calibrate the time on the tree.

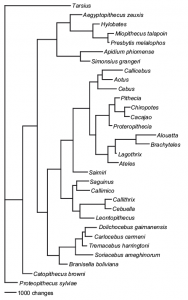
On the other hand, Kay et al. 2008 published an awesome study of the Platyrrhini history from a palaeontological point of view. They focused on 20 living taxa combined with 11 fossil species and using 268 morphological characters.

Kay.et.al~2008-Fig21
Kay et al. 2008 Fig. 21. A Platyrrhini phylogeny based on morphological data including fossils.

Again, there are both advantages and problems associated with this approach. Firstly, the number of characters used is pretty low; don’t get me wrong, 268 is really good for a morphological matrix, it’s just low compared to molecular data. Furthermore, the underlying evolutionary models used to build the phylogeny are hard to infer, the most common model is the Lewis 2001 Mk model where morphological characters are treated as if they  “act like” molecular sites with no assumptions made about their states or rates of change (this method has been criticized but it’s still our best way to infer morphological evolution). Another solution, which is also commonly used, is to infer nothing but instead just use a maximum parsimony approach: find the tree which explains observed phenotypic evolution with the fewest number of evolutionary steps (characters changing from one state to another on a particular node within the tree). However, compared to a purely molecular approach, the advantages of Kay’s tree are clear from a macroevolutionary point of view: this tree includes full information from the morphologies of both living and fossil species!

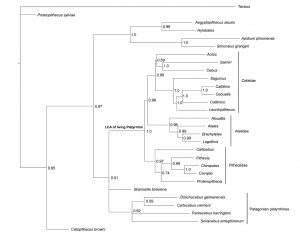
Now hopefully you can see where I’m coming from in wanting to use the total evidence method? It’s clear from the empirical examples above that the problems associated with one approach are the advantages in the other. So let’s just combine them! And that’s what Schrago did in their work, they just mixed both data sets and re-ran the analysis (or, more precisely, they used Kay’s data set as it was but added new genomic data collected over the last seven years to Opazo’s data set). Here’s their result:

Schrago.et.al~2006-Fig2
Schrago et al. 2013 Fig 2. Phylogeny of extant and extinct Platyrrhini using both molecular and morphological data.

So here we have the advantage of both methods combined and this tree is far more user friendly for macroevolutionary studies; one can test evolutionary hypothesis through time using a more complete representation of the Platyrrhini evolutionary history. One major problem still remains though; the paucity of useful morphological data compared to the wealth of molecular data which is now available. Does that influence the tree’s topology somehow? Well, stay tuned, my simulations are running…

Author: Thomas Guillerme, guillert[at]tcd.ie, @TGuillerme

Photo credit: wikimedia commons