As I mentioned in a former blog post, we invited François Gould (@PaleoGould) to enlighten us about the murky world of geometric morphometrics. His talk and workshop were eventually described by some people (@SiveFinlay – to protect her identity) as “the best day of [their] PhD so far!” I will clumsily try to summarize our awesome day of morphometrics.
What?
François emphasized the importance of seeing geometric morphometrics (hereafter let’s be familiar and just call it morphometrics) as a toolkit of methods for shape variation analysis more than a discipline in itself. So one can use this toolkit to describe and analyse the variation of shape defined as the “aspects of geometry invariant to rotation translation and reflection”. To get your head around this definition, one example François gave which I found really useful is that if you drop a pile of A4 papers, they will still have the same shape even if some sneaky ones tried to rotate, translate or reflect while falling on the floor.
As a practical example, understanding shape variation allows you to study superiority, competition and opportunism in the evolutionary radiation of Dinosaurs.
How?
So here’s where we get to all the technical mumbo jumbo at the heart of morphometrics. As François explained to us, it is way easier to think about morphometric ideas than to formally explain the mathematics behind them and many knowledgeable morphometricians are still arguing about the theory underpinning morphometric methods. I don’t have the talent or the knowledge to talk about so I’ll leave it up to the experts here, here and here.
However, I’d like to show you the general methods and share some of François’ comments.
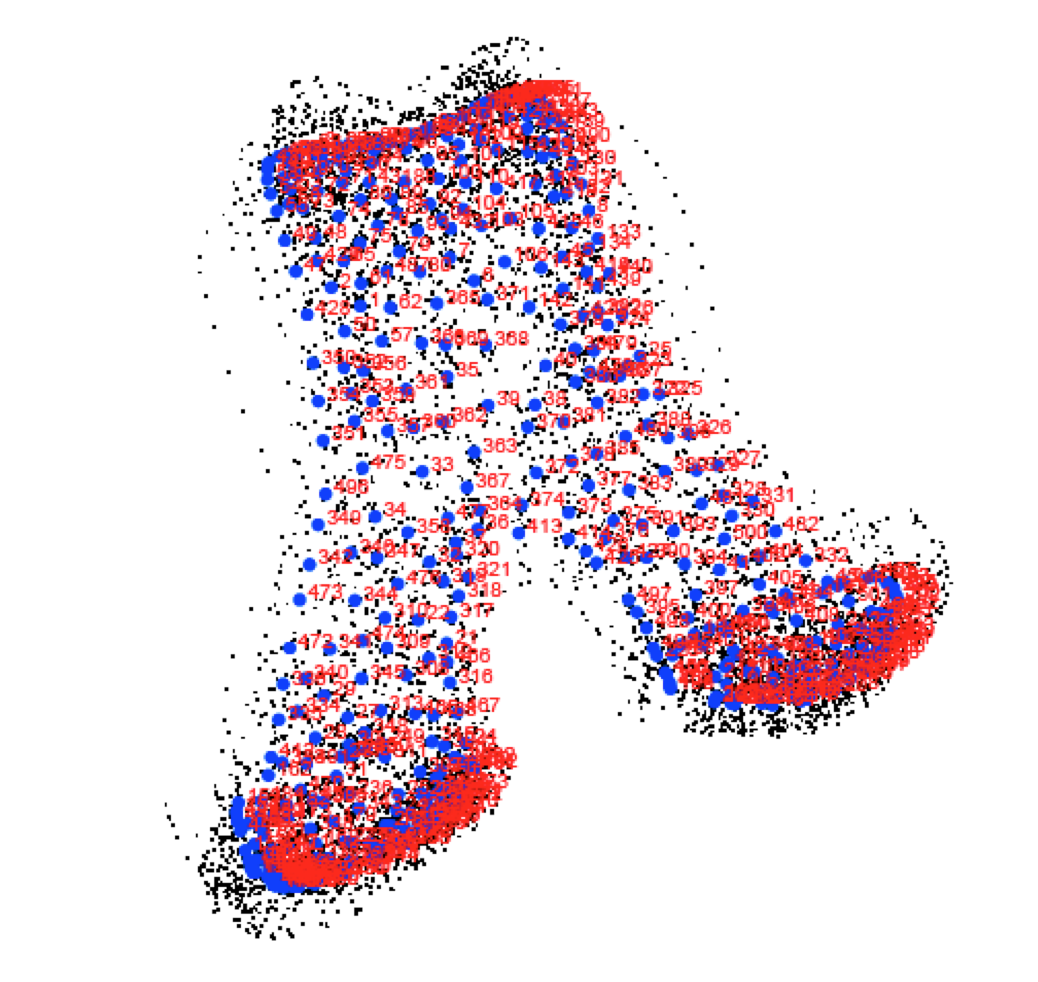
So, regarding the different analyses you can do, the most common approach is to use landmarks; homologous points on a biological object. You place them on the different items you want to analyse using either 2D images or 3D scans. The trick with working with landmarks lies in paying attention to their homology and their number (some of the debates and details about this crucial step can be found here or here). Then you can “translate, rotate and scale the shapes with a least squares fit” in order to compare your different objects (that’s the Procrustes method, named after the mythological blacksmith who distorted his victims to fit an iron bed, who said morphometricians weren’t cultured?). Depending on your question, the resolution of your images and your study objects, alternative methods could be more appropriate to deal with novel structures or curves but again, I’ll pass you on to the excellent literature on this topic.
(picture courtesy of François Gould)

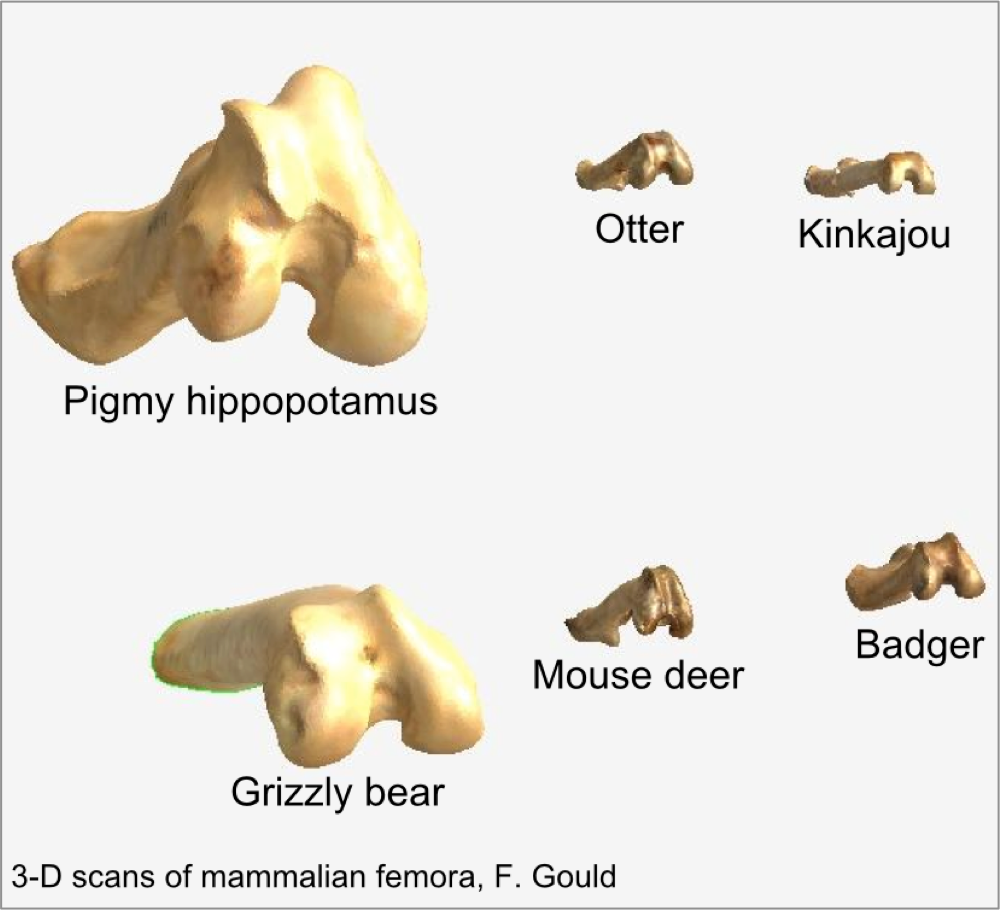
(picture courtesy of François Gould)
This is an excellent summary, both theoretical and practical, which details some of the amazing possibilities when using this toolkit of methods.
Before embarking on your own morphometric analyses, here are François’ useful questions (slightly paraphrased!) which you should ask yourself:
1) What the heck are you doing? You can use morphometrics for data exploration or for hypothesis testing; make sure you know what your question is before you start collecting your data.
2) How are you gonna do that? Many tools exist to analyse shape, from old-school calipers to a CT scanner. All give good results depending on what your question is.
3) What analyses are you gonna use? Again, that all depends on the crucial first step but after François’ talk I recommend this nice review which will help you find out what’s the best fit for your question.
I gratefully thank François Gould as most of the information in this post comes from his workshop (the slides from which can be found here) and the rich discussions we had (plus the massive amount of morpho chat he had with other people and where I sneaked in to absorb some of his extensive morphometric knowledge).
Author
Thomas Guillerme: guillert[at]tcd.ie
Photo credits
François Gould (@PaleoGould)