I would like to say that the talk presented a range of evidence for intelligent design and carefully countered the usual arguments against it. I would like to say this, but I can’t. The talk, which lasted over one hour, spent much of the time quoting non-scientists and misquoting scientists, painting ID proponents as martyrs to the cause and science as tautologically incapable of addressing questions of design. The religious beliefs of ID proponents were constantly referred to, despite supposedly being completely irrelevant, which was an indication that this was, after all, a religious proposition not a scientific one.
It would be easy to question the credentials of Dr Alistair Noble (PhD in chemistry) and ask how someone who has been outside of scientific academia longer than I have been alive can claim to have found fundamental flaws that no working biologist has been able to find, but I won’t. Instead, I have tried to focus on the claims of Dr Noble and see if they can be answered (see my last blog post).
There is much more that I could have said. The case for evolution is so strong that I could go on for hours about the evidence from multiple disciplines that support it. It seems that the same cannot be said for intelligent design. Dr Noble spent about 15 minutes of his (more than) one hour talk providing evidence which can be easily refuted by anyone who has even a basic understanding of evolutionary theory. His ‘evidence’ ultimately boiled down to an Argument from Incredulity with a side helping of the Argument from Authority.
I was disappointed by the lack of scientific rigor Dr Noble exhibited. Not one journal article was presented, not a single claim that hasn’t been refuted multiple times before. I had hoped for an intellectually stimulating talk that would force me to question my understanding of evolutionary theory but instead I was confronted with the same, tired claims that have been presented by ID proponents for years now. It is a shame that Dr Noble could not have used his clearly considerable intellect to study the actual science and see that evolutionary theory is not a threat to his faith but is an amazingly simple yet profound explanation into how the diversity of life arose.
*by parasites here I am referring to all kinds of infectious disease causing agents including bacteria, viruses, fungi, protozoa, helminths and arthropods.
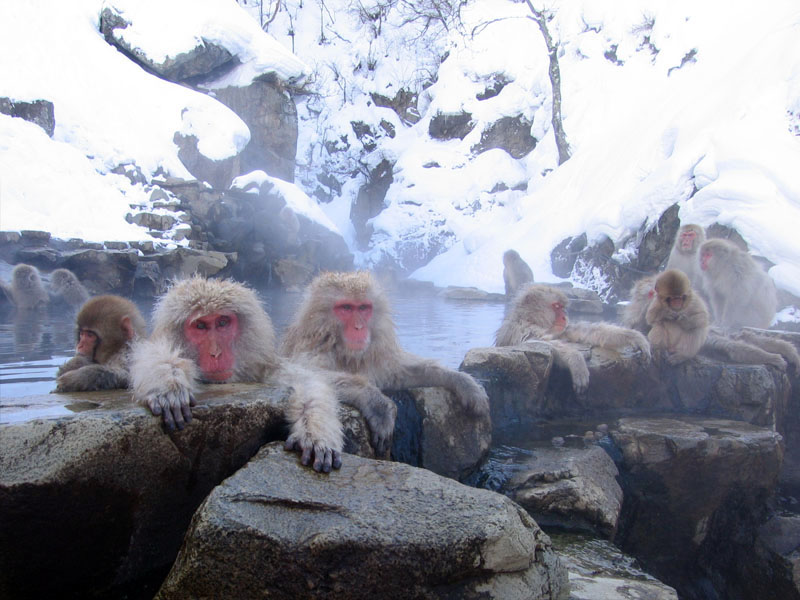
Why do we care about primate parasites?
Many of the most devastating infectious diseases in humans have origins in wildlife. For example, the global AIDS pandemic originated through human contact with wild African primates and influenza viruses circulate among wild bird populations. These are not only historical occurrences. Recently, for example, rodents were identified as the source of a Hantavirus outbreak in Yosemite National Park, USA . As human populations continue to expand into new areas and global changes in temperature and habitat alter the distributions of wild animals, humans around the world will have greater contact with wildlife. Thus, understanding which infectious agents have the potential to spread from animals to humans is crucial for preventing future human disease outbreaks.
Many efforts are being made to collate information on wildlife and human diseases. Much of my research (which I will blog about when I get chance!) uses an amazing database known as the Global Mammal Parasite Database or GMPD for short. Every time a paper is published which contains details of parasites found in either primates, carnivores or ungulates, the information is added to the database. As much data as possible is recorded, including the species infected, the type of parasite, the prevalence of the parasite, and the geographic location of the study. Prof. Charles Nunn and his colleagues have been collecting data for the GMPD since around 2005 and it currently contains around 6000 records for primates alone. This definitely makes it the most comprehensive dataset of primate parasites in existence.
The GMPD sounds amazing…so what’s the problem?
The problem with the GMPD (and this is a feature of virtually all datasets) is that there is sampling bias. Certain primates are sampled for parasites much more frequently than others. Chimpanzees, for example, are sampled for parasites all the time, whereas species such as tarsiers are sampled much less often. This has the effect of making it look like chimpanzees have far more parasites than tarsiers, simply because they have been sampled more often. In analyses using the database we usually deal with this problem by adding sampling effort into our models, so we give less emphasis to high numbers of parasites in primates we have lots of samples for. Unfortunately this problem is also evident when we look at parasites (things like malarial parasites are often sampled because of their importance to human health) and geographic regions (areas with primate research stations are sampled far more regularly than more remote regions). If we hope to use the GMPD data to make reliable predictions about future risks to humans, we need to identify gaps in our knowledge of primate parasites.
So what did you do?
Without going into the technical details, we looked across the primate phylogeny and primate geographic ranges to identify gaps in our knowledge, and used statistical models to investigate what factors led to primates and geographic areas being relatively well- or relatively poorly-sampled. We also used species accumulation curves to extrapolate parasite species richness for primates.
Where are the gaps in our knowledge?
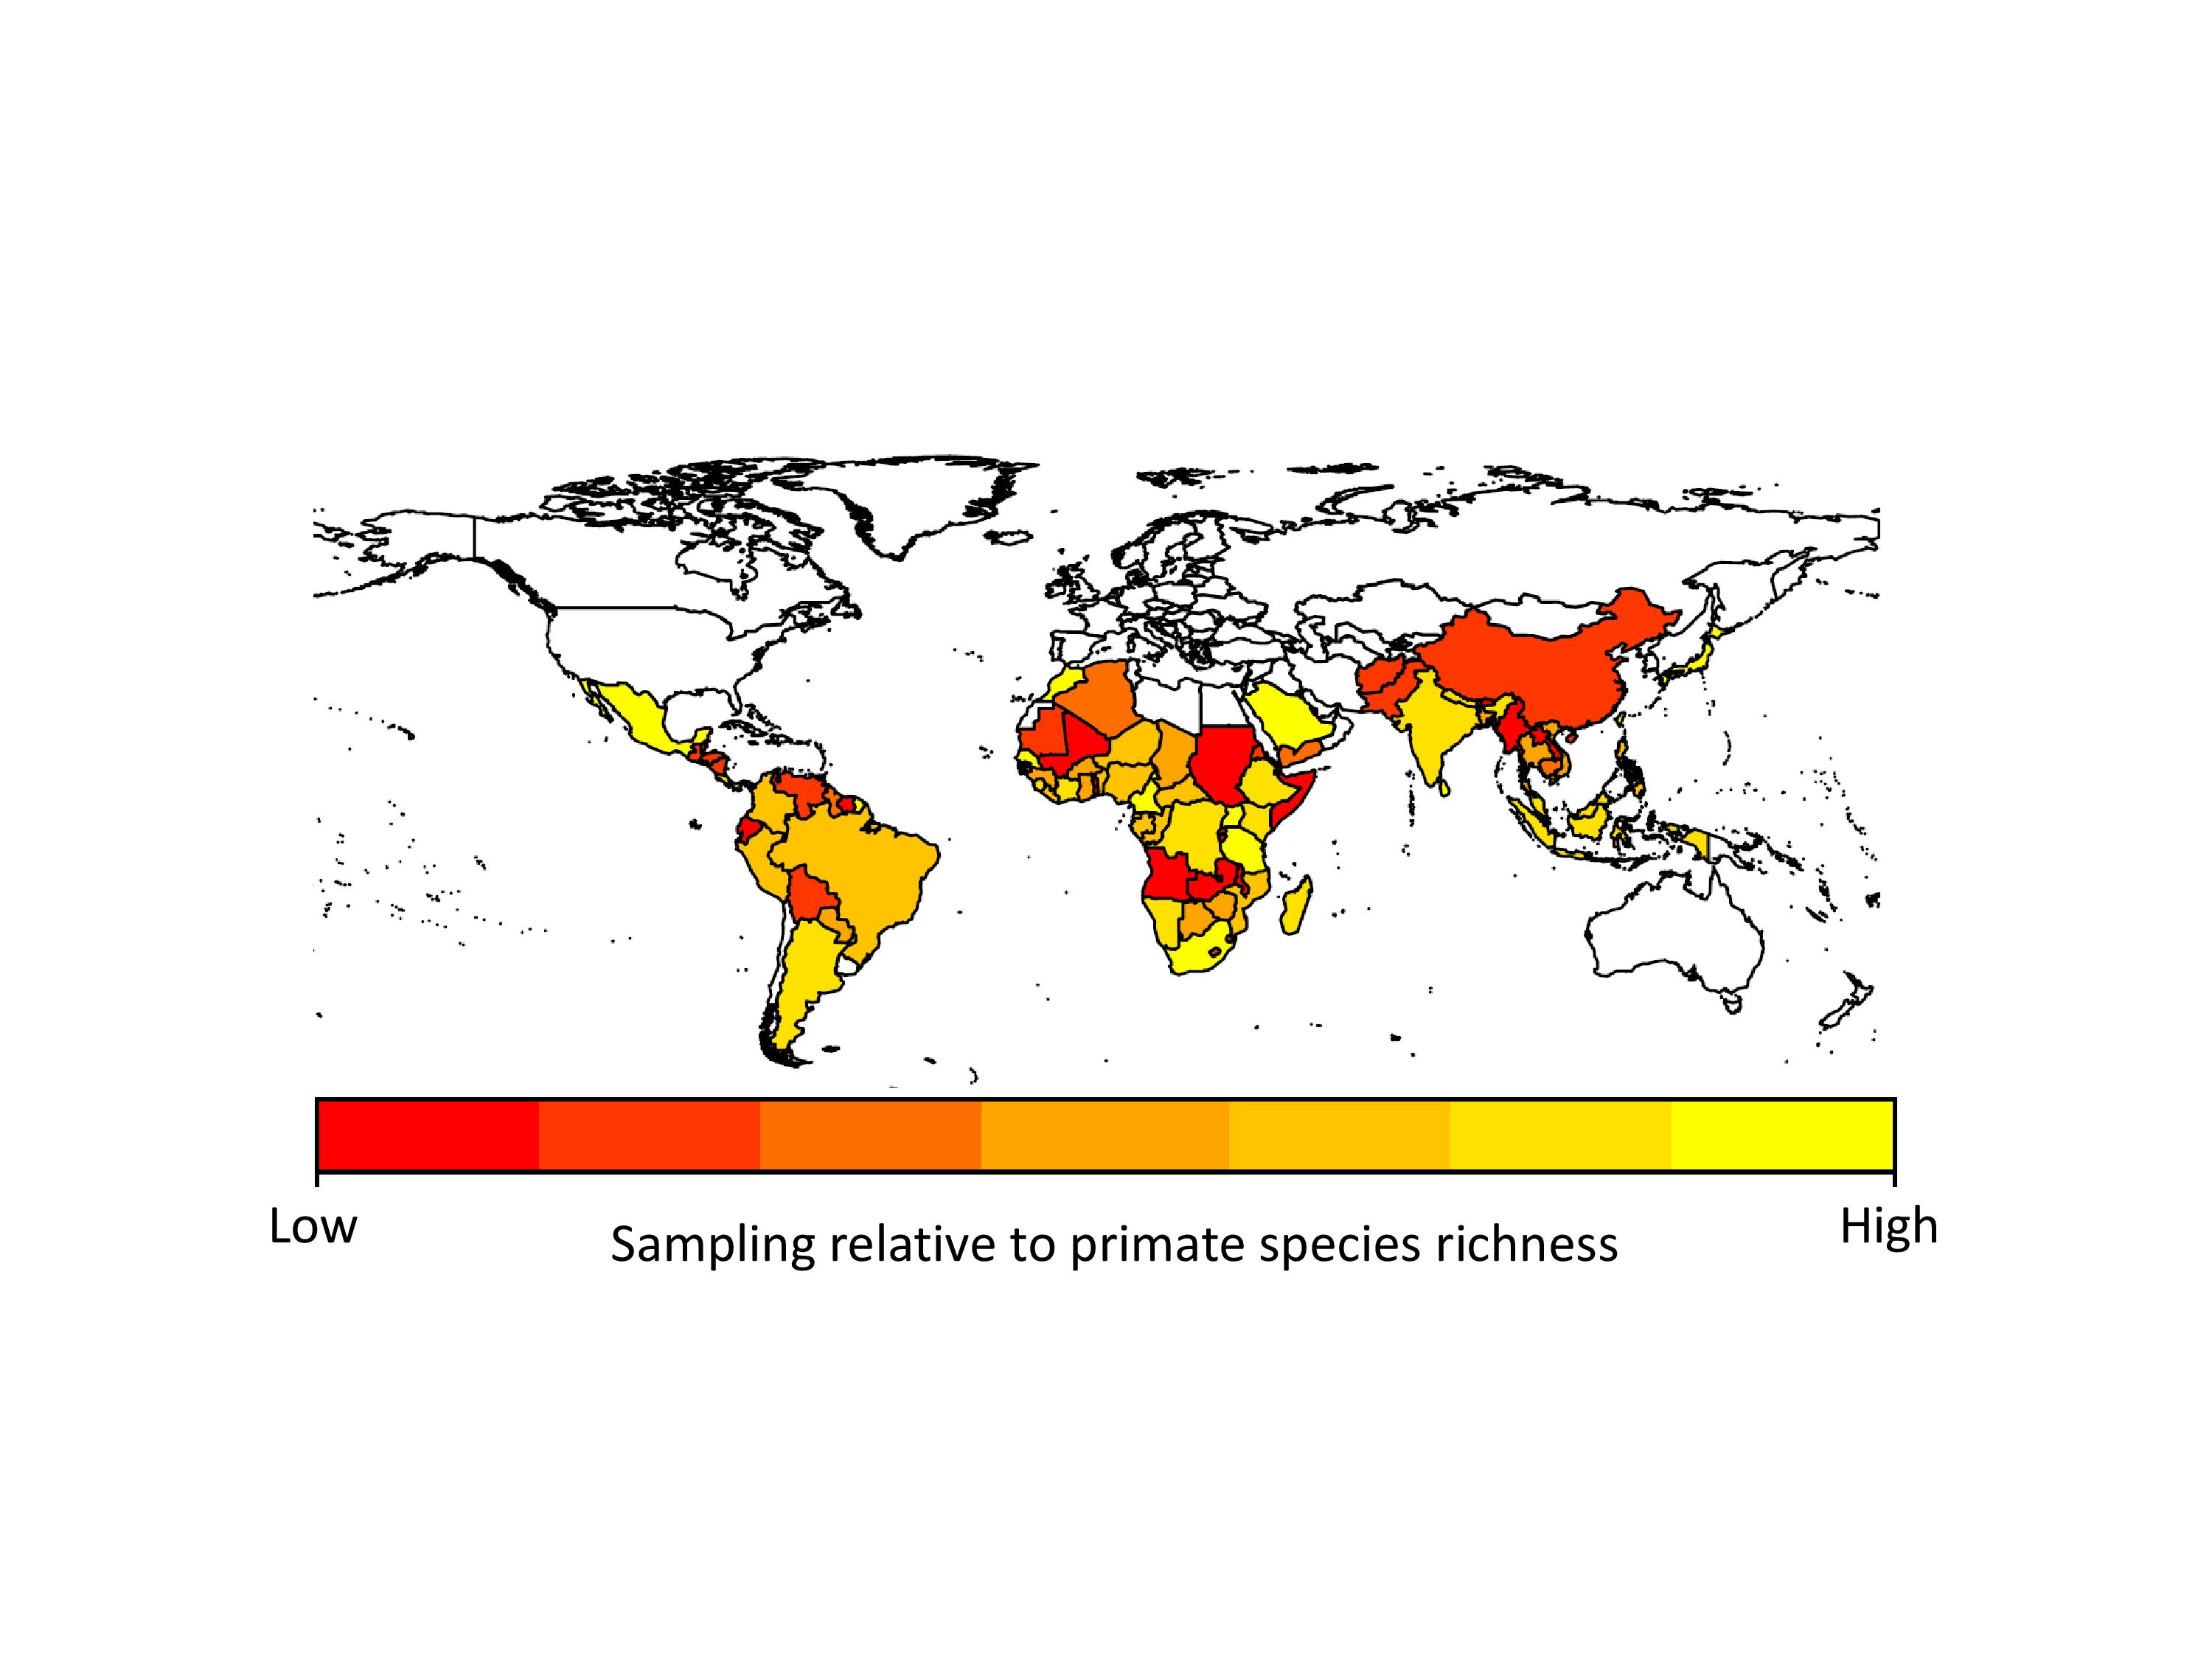
We found that apes (chimpanzees, gorillas and orangutans) were generally better-sampled than other primates, but there was incredible variation in sampling among all other major primate groups. Apart from apes, the primates that researchers appear to sample most are the species they encounter most often, i.e., widespread, terrestrial, diurnal species. However, some primates were sampled more often because they are already intensively studied for other research, because they live in frequently visited field sites, or because of their importance in medical research. Across countries, we found that in general, parasite sampling is highest in countries with more primates to sample. We expected that the GDP of the countries would also affect sampling effort, with wealthier countries having more money for disease monitoring. However, we found no evidence for this in our analyses, probably because most research on primate diseases is not funded by the country in which the research takes place.
Sampling effort for primate parasites across the world. Poorly-sampled countries are in red, and better sampled countries are in yellow.
When we extrapolated parasite species richness values we found that even within our best-sampled primates and countries, we are missing a lot of parasites. On average we predicted that 38-79% more parasite species than currently reported in the GMPD should be found in our best sampled primate species, and 29-40% more parasite species than currently reported in the GMPD should be found in our best sampled countries. This emphasizes exactly how poor our sampling is across all primates and countries. Another concern is that although viruses make up only 12% of the parasites in our dataset, viruses arguably present the greatest zoonotic disease threat to humans because their fast rates of evolution should allow them to easily adapt to new hosts.
What next?
Identifying parasite sampling gaps across primate species and geographic regions is only the first step; we need to find strategies to minimize these sampling gaps if we are to predict which primate diseases may emerge in humans. One solution is to set research priorities based on the sampling gaps, for example, by focusing effort and funding on relatively poorly-sampled primate species, arboreal primates, those with small geographic ranges, or those found in relatively poorly-sampled regions of South East Asia, Central and Western Africa, and South America.
Focusing on relatively poorly-sampled primate species and areas may improve our general understanding of primate parasites, but it is only one factor in predicting risk to humans. For example, hosts are more likely to share parasites with their close relatives than with more distant relatives. Thus, continuing to focus our sampling efforts on parasites of our closest relatives (chimpanzees, gorillas and orangutans) may provide the greatest return in the case of risks to humans. This is particularly important because we found that chimpanzees are expected to have 33-50% more parasites than currently found in the GMPD. In addition, ecological similarities also influence parasite sharing among primates, and humans share more parasites with terrestrial than arboreal primate species. As with sampling effort, this probably reflects higher contact rates among humans and terrestrial primates compared to arboreal primates. As a related issue, a host living at higher density is expected to have higher prevalence of parasites and may have more contact with human populations or our domesticated animals, thus increasing opportunities for host shifts to humans. The large numbers of zoonotic emerging infectious diseases with rodent or domesticated animal sources also highlight the importance of rates of contact and host density for disease emergence in humans.
In conclusion Sampling effort for primate parasites is uneven and low. The sobering message is that we know little about even the best studied primates, and even less regarding the spatial and temporal distribution of parasitism within species. Much more sampling is needed if we hope to predict or prevent future emerging infectious diseases outbreaks.
Recently Science published O’Leary et al.’s – new load of oil to fuel the burning debate on the origins of placental mammals.
Just to be clear: there is an important distinction between mammals in general that includes many fossils from the Jurassic as well as the extant platypus, kangaroo and your grandma; and placental mammals that includes your grandma and the armadillo (but not kangaroos or the platypus) and no fossil before 65Myr. For readers that are not used to the debate concerning the first placental mammal here’s the main question: did the first placental mammals diversify before or after 65Myr (the important KT boundary)?
(1) After Katie
One view suggests that early mammals lived in the shadow of dinosaurs and the demise of these mighty creatures allowed our rat-like ancestors to take over the earth, the seas and the skies “Save yourself mammals”. This idea was proposed by Simpson in the 1950’s and is supported by the fossil record; many dinosaurs (both big and small) were present before the 65 Myr KT boundary, then a catastrophic meteorite impact marked the KT limit and placental mammals radiated after that. This sequence of events seems to be very straightforward but reality appears not to be so simple. Increasing numbers of mammal species from the late Cretaceous are being discovered, (including rather big ones feeding on dinosaurs) and not many species in general are found in the fossil record before 55Myr when all groups of placental mammals seem to suddenly appear (for a full story see Luo’s 2007 Nature review).
(2) Before Katie
In contrast, another group of people, mainly assisted by molecular dating methods, found out that post-KT placental mammalian diversification may just be an artefact of the fossil record (like Meredith et al 2011 in Science again). Their DNA evidence seems to say that placental mammals evolved before the KT limit and that either palaeontologists failed to find them or else the fossil record failed to preserve them. One major criticism that moderate people argue is that there are still problems associated with molecular dating methods. I won’t go into the details (yes I’m trying hard not to) but molecular dating relies on DNA on the one hand (sampling quality and modelling) and on the fossil record on the other hand. So if the people using DNA criticise the fossil record and want to improve the DNA dating estimates, they have to rely on the same fossil record that they are criticising. The snake bites his own tail.
So what about O’Leary and colleague’s paper? They basically support the first theory (placental mammals evolved after KT). Fair enough, it was led by a number of great palaeontologists and based on a massive morphological data set (~4500 characters introduced as phenomics (from the phenotype) as opposed to genomics (from the genome) data) collected on 40 unambiguous fossils and 46 extant placental mammals. Genomic data based on 26 genes of these extant placental mammals was also included. This paper is the result of an impressive and unique collaborative work, but – Ned Stark from Games of Thrones said “nothing someone says before the word “but” really counts” – but this paper is criticisable…
First of all, the data set: although the morphological data is impressive, the taxa sampling effort seems a bit weak, especially for extant placental mammals. Meredith et al used the same genomic data (26 genes) but based on ~164 mammals to answer the same question. Why couldn’t O’Leary use all of this already published mammal DNA? For the second criticism, I’m just going to quote Yoder’s review published in the same issue “Today, sophisticated theoretical and computational methods are used to estimate and calibrate molecular phylogenetic branch lengths (which represent time). Together with improved methods for integrating fossil and molecular data, dates derived from molecular phylogenies have inched closer to those implied by the fossil record. Is the approach used in the O’Leary et al. study directly comparable to these recent molecular phylogenetic studies? Not really, as it turns out.”
No wonder this paper supports the first theory, it is just a precise and massive analysis of the 40 species of the placental mammals fossil record. Personally, I’m really frustrated by how they managed to publish this paper. Since it’s part of my PhD research, I automatically get excited when I see fossils mixing with extant species so I really hoped this paper would link the two approaches instead of supporting the old fashioned view of evolution (the dinosaurs dying and the mammals taking over). I’d like to think that the history of life is a bit more complex and exciting…
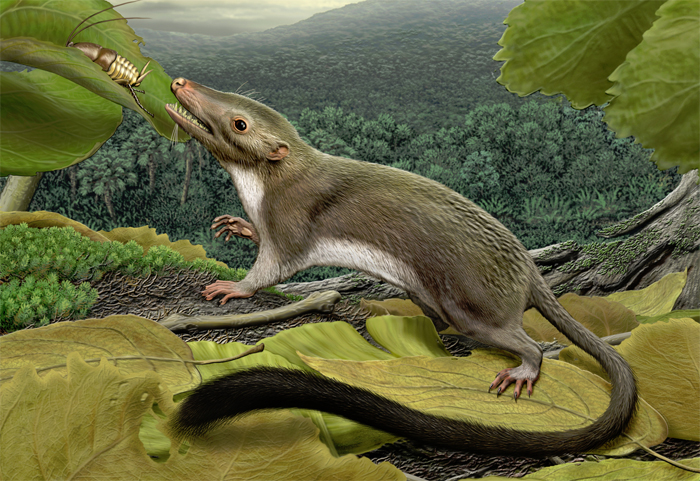
A last comment to justify my title and which will be my main critique to this paper is that O’Leary et al. tried to recreate the “hypothetical placental mammal ancestor”.
As I said, this paper could be seen as a summary of the placental mammal fossil record. So why did they break the first rule that keeps palaeontology away from palaeo-poetry (i.e. going too far with palaeontological hypotheses)? Here they reconstructed a whole creature using their morphological data. What they made was essentially a mean (average) placental mammal (a primitive rat-like creature) – a throw-back to the early stages of palaeontological views of mammalian evolution. What did the ancestor of a duck and a beaver look like? Something in between – a platypus for example? As Olaf Bininda-Edmonds said on Ed-Yong’s Nature post “comparing the two estimates is like comparing “apples and oranges”, they haven’t really done anything to resolve this on-going dispute”.
This paper has also caused controversy on twitter. I’ll just cite two opinions.
Gavin Thomas (@Phalaropus)
“The reconstruction is fun – I’d love to see a picture based on 95% CIs for the ancestral states.”
and Rich Grenyer’s answer (@rich_)
“yes indeed. Something like this” (see our title image).
Many parts of the online science community got excited about this paper, you can see further discussions on Jerry A Coyne’s blog (here and here), on Ed Yong’s one (here and here or there) or else on the twitter feed #placental.
“A lie can travel halfway round the world before the truth has got its boots on” (Mark Twain, attributed).
In my previous post I gave some background on intelligent design, the theme of a talk I recently attended by Dr Alistair Noble. This time, I’ll try and address his claims.
It is easy to say something that is not true. It is not always so easy to explain why it is not true. Such is my problem here. I can summarise Dr Noble’s arguments into a few sentences, but it takes paragraphs to explain why they are wrong. Here goes!
His argument centered around DNA. Dr Noble’s background in chemistry, specifically in trying to artificially synthesise chemicals, showed him how difficult it was to make even simple molecules. He explained his problems with DNA and used two specific examples to illustrate his argument: the bacterial flagellum and cytochrome C. His arguments were essentially:
they look designed
they are too complex to have arisen by chance
The design argument can be easily refuted. Apparent design does not mean actual design. Humans are extremely good at seeing things where they do not exist, like shapes in clouds and Jesus on burnt toast. This is a well-known psychological phenomena called paradolia and can lead us to see design where none exists.
The second claim requires a bit more care. DNA, the bacterial flagellum and Cytochrome C are all highly complex and could not have evolved by chance. In fact, as Dr Noble so carefully illustrated, Cytochrome C would have taken longer than the lifetime of the universe to arise by chance. So if they did not arise by chance then they must have arisen by design, surely? Well, no.
This conclusion can only be made if you have a deep misunderstanding of evolution. At a very basic level random mutations occur which may be beneficial, neutral, or detrimental to an individual. Then natural selection ‘selects’ those mutations which are beneficial and ‘rejects’ those that the detrimental. Small changes over long timescales lead to big changes, mutations can build on each other and can be co-opted to other functions. The bacterial flagellum is a perfect example, with studies showing how molecules were co-opted from other functions to form the flagella. At no point was there a useless proto-flagellum.
ID proponents, including Dr Noble, focus on the random aspect of evolution but completely ignore the selection part, which is arguably the more important aspect. If there were no natural selection then their claims would be valid, but its presence provides a beautifully simple explanation of how complex molecules, complex biological components, and even complex organisms could arise.
Trinity College Theological Society recently held a talk by Dr Alistair Noble titled ‘A Scientific Case for Intelligent Design’ which I attended as, possibly, the only biologist in the room. It was a fascinating, if deeply frustrating, experience. Before I get into the details of the talk, a brief explanation of intelligent design may be necessary. . .
Intelligent design (ID) is the ‘theory’ that certain features of the universe, including life, are best explained by invoking a creator. I put ‘theory’ in quotes because in a scientific theory is a very particular beast. It must have both explanatory and predictive powers. For example, the theory of evolution by natural selection explains how life evolved and can also be used to make predications about life that can be tested. The ‘theory’ of intelligent design has little explanatory power (“the designer did it”) and makes no predictions. As such, it is held with little esteem within the scientific community.
Outside the scientific community, however, there are some who hold ID in very high esteem. They think that it is a credible scientific theory and there have been many attempts, particularly in the U.S., to have ID taught in schools as a counter to evolution. This is deeply worrying to those who care about scientific literacy but has to be tackled carefully.
The reason for such caution is that ID is most loudly promoted by religious groups who feel that the theory of evolution is anathema to their beliefs and as such must be countered. In the past they countered with Creationism, but in recent years they have tried to remove the explicit religious overtones of Creationism, removing God, replacing him with an unspecified ‘designer’ and calling the new theory ‘intelligent design’. Thus the debate around ID is not just a scientific debate but is also a religious debate involving deeply held personal beliefs.
I hold the opinion that your personal beliefs are yours, and are no concern of mine, but when you try and mess with science, well, that’s another story! I went to the talk as I was curious to hear the scientific evidence for ID. Would it persuade me that there was a case for ID? . . .
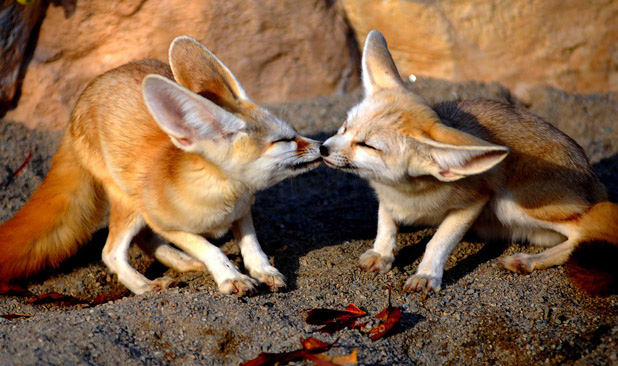
Why is it that the first things that happen upon seeing a pudgy baby panda, fluffy penguin or tumbling kitten are usually utterances of “squeezing it”, “eating it” or “smushing it”!?
We’ve been talking quite a bit about ‘cuteness’ in the department for a while now; what makes an animal cute, animals exploiting that inbuilt ‘cuteness measure’ we seem to have (*cough* Cats *cough*!!), there was even talk of making a ‘cuteness coefficient’ to see how closely mammals and birds illicit the same responses. While we agreed that the degree of cuteness is definitely a personal thing, there is certainly a general idea that we as humans all seem to hold as universally cute. These usually include a host of wide-eyed, round headed, roly-poly baby animals. There are a number of evolutionary theories behind why we find animals cute (Jerry Coyne’s blog has a nice summary), but what we didn’t discuss, and something which only occurred to me recently upon reading about a new study, was that, not only are our perceptions of cuteness relatively universal (hence the overwhelming number of kittens on the internet), but that so were our reactions, though not in the way you would intuitively expect.
Why do we seem to have an overly aggressive response to cute and fluffy animals? The reaction of most people to a big-eyed bundle of adorableness is not “ I want to hold you and keep you safe forever” or “ I want to coo at you from a distance” but instead expressions of violence and threats of immediate harm! People are compelled to express violent urges on encountering what seems to be insurmountable cuteness. Many people in fact can’t even keep still when something cute comes along- teeth are clenched and hands struggle to fight the “must squish it” impulse.
A recent study presented in New Orleans by the Society for Personality and Social Psychology decided to look deeper into this phenomenon and further, to see whether these verbal expressions of feeling were actually translated into actions. To do this they selected 3 groups of people, and, telling them that this was a study about motor activity, they handed out sheets of bubble wrap to each person. They were free to pop as many or few bubbles as they felt while watching one of three slideshows. One was of funny animals (e.g. dog with its head out of the window), another of serious or plain animals photos and the third of cute animals. Those who watched the cute animal slideshow popped an average of 1/3 more bubbles over the other groups. What this demonstrates is a potential for those violent utterances to be translated into actions: think of an old aunt squeezing her nephews cheeks or an over zealous toddler hugging a cat until it can’t breathe.
The researchers think that, far from people actually wanting to fry up and devour a basket of puppies, these expressions are a way of coping with the situation: “I can’t handle it”, “too cute”, “emotional overload… need an output” sort of thing. The three hypotheses they put forward for this were:
We have an impulse to care for what we perceive as cute for evolutionary reasons. The problem is that not everything we see we can care for (particularly if it is a photo!) and as such we get frustrated.
Too much love: The yearning to care is so strong and we simply get carried away (much like the aforementioned over zealous toddler).
It is simply an emotional overload that we don’t know how to deal with so act on some form of displacement activity.
So it seems, for whatever reason, when people complain about the number of sickly cute animals on the internet or the superfluous efforts put into conservation for the panda rather than the pig-nosed frog in the context of how much they want to “just punch them the face”, what they are really saying is that they cannot handle the emotional overload induced by those animals and that they want to express their love.
We love to explore and our adventures into outer space represent the acme of our derring-do. But when we leave our cozy planet we put an awful lot of stress on our minds and bodies. The billions of years of evolutionary pressures exerted on our ancestors all took place within the confines of Earth so a sudden dose of zero gravity is completely alien to us.
Some of the effects of space travel will give even those among you with the right stuff cause for pause.
There are the obvious perils like the terrifying oxygen-less vacuum of space but other, less obvious, afflictions abound.
Okay, so our skeletal system allows us to saunter around this planet quite comfortably. The whole point of the system is to provide some structure and locomotory ability against the force of gravity. But remove the pull and the bones start to wither away. There’s no longer any strain for the bones to resist. It happens at quite an alarming rate too. An average (?) astronaut can expect to lose 1% of his bone mass per month due to spaceflight osteopenia.
Still there’s no shortage of people who’d jump at the chance to be a star voyager for a few months.
But with longer flights, like a mission to Mars, there are even more insidious problems to consider. Back in 2010, six astronauts were selected to simulate such a mission (I was rejected for being too tall). They were locked in a room modeled on a spacecraft and given tasks that would be typical of such a journey. The whole ‘trip’ took 520 days and was an effort to better understand what happens to a person during a period of prolonged isolation.
While not quite space madness the six developed a range of symptoms. Chief among them were hypokinesis and disturbed sleep-wake cycles. The authors of the study describing the effects believe that the cause of these problems was a disruption to the circadian rhythms of the people involved. On Earth, we have our 24 hour day with its predictable light and dark cycle. But in space there is no such thing. Subtle changes in light can throw off your internal clock. This would be quite problematic. If one person has changed to a 25 hour day this can destroy the working ability of the team because he’ll find himself sleeping when everyone else is up.
It’s quite frustrating that we don’t have a biological blank slate that can adapt to all conditions. When we blast off from Earth, one thing we don’t leave behind is our evolutionary past.
A paper just published in the Proceedings of the National Academy of Sciences USA (including Trevor Hodkinson, Botany, School of Natural Sciences, TCD; Trinity Centre for Biodiversity Research) highlights the role of leaf anatomical change in the evolution of a type of photosynthesis (classified as C4) that has allowed a large group of grass species to dominate warm regions of the world and become important crops such as maize, sorghum and sugarcane. C4 photosynthesis is a series of anatomical and biochemical modifications to the typical C3 pathway that increases the productivity of plants in warm and dry conditions. The C4 trait has evolved over 20 times in grasses, and all origins occurred within one species rich group. Leaf anatomy traits of grasses were quantified and analyzed in an evolutionary framework.
Statistical modeling indicates that C4 evolvability strongly increases when a particular type of anatomy (proportion of vascular bundle sheath) reaches 15%. A reduction in the distance between the bundle sheaths occurred before the evolution of the C4 grass group but not in other groups of grasses which lack the C4 trait. Therefore, when environmental changes promoted C4 evolution, suitable anatomy was present only in members of this group, explaining the clustering of C4 origins in this group. These results show that key alterations of leaf anatomy facilitated the repeated evolution of one of the most successful physiological innovations in flowering plant history.
One of the many things I love about Zoology is the opportunity to work away from a desk. As an undergraduate I enjoyed field courses and summer projects in the not so exotic wilds of Ireland and Cambridgeshire – great experiences but not quite a match for the glamour of the recent TCD trip to Kenya! Last summer, however, I was fortunate enough to expand my zoological horizons by working as a field assistant in the Greek Islands.
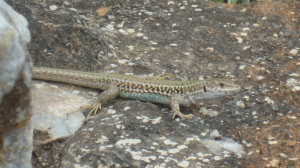
I travelled to the remote island of Folegandros, one of the quieter tourist destinations in the Cyclades, to assist Kate Marshall, a PhD student in Behavioural Ecology at the University of Cambridge (supervised by Dr. Martin Stevens and Professor Nick Davies). Kate’s research focuses on the evolution of morphological and colouration phenotypic divergences in Erhard’s wall lizards (Podarcis erhardii). She is particularly interested in studying the roles of both natural selection (adaptations to avoid predators) and sexual selection (signals to other lizards) in driving the evolution of varied colour patterns in lizard populations on different islands.
Kate is modelling the lizards’ colouration from the perspectives of predators (birds) and conspecifics (other lizards). Some of her early results indicate that P. erhardii populations have evolved colour patterns and behaviours that are locally adapted to different island environments. Dorsal and head colour patterns seem to be well matched to the lizards’ local environments- indicating a possible function in predator avoidance – while the lizards’ sides are brightly coloured and may play roles in conspecific signalling and sexual selection (Fig. 1).
Fig.1: A male of an island subspecies of Erhard’s wall lizard (P.e.mykonensis). The brighter blue colouration along the side of the body, which seems to be involved in conspecific signalling, is clearly visible.
Some of the most enjoyable parts of my time in Greece involved trying out the unusual techniques which form part of Kate’s research methods. For example, I helped her conduct a pilot study to assess whether predator attacks on the lizards might vary in different islands. This involved making 3D lizards out of modelling clay, distributing them across line transects and checking them for signs of predator attacks such as rodent bite marks. The whole process attracted a few curious looks from the locals as we marched through town with boxes of clay lizards! However, these glances were nothing compared to the reactions elicited by our lizard wrangling attempts. Using an extendable fishing rod, dental floss and noose-tying know-how, we patrolled the island’s hiking paths trying to catch unsuspecting sunbathing lizards by slipping the noose around their necks. The technique was successful in some of Kate’s other field sites but unfortunately we had no such luck during my time – just some very confused stares from locals and tourists as we slowly “fished” our way down the mountain side!
I thoroughly enjoyed my time helping out in Greece. The project covers an interesting area of evolutionary biology – studying the often conflicting influences of both natural and sexual selection in driving phenotypic divergences within species. It was also a great learning experience because it gave me an insight into some of the details and challenges involved in planning a PhD before I started my own project. Finally (and perhaps most importantly), it wasn’t all hard work – combining fieldwork with swimming in the clear blue Aegean or afternoons at the beach were just further confirmations that you can’t beat the perks of being a Zoology student!


