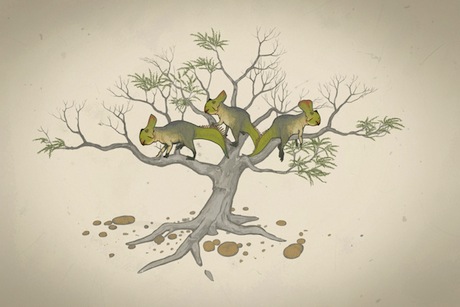
Nature News published a new post about our origins. It’s promoting Stevens et al’s 2013 paper that published the description from two new granddads/grandmas in our already complicated family tree. These guys, Nsungwepithecus and Rukwapithecus (it’s not that hard to pronounce, try it) are considered by Stevens and his team as the oldest crown Catarrhines – [Google translate palaeo-primatish to English: “as closely related as the ancestors of you and your cousin the proboscis monkey (we all knew there were some facial similarities!)”]. Technically speaking, these fossil discoveries pushed the origin of modern Catarrhines back from 20 to 25 million years ago, a date which is closer to molecular results (25-30 mya). Astonishing eh? Well it is for me but there’s another reason why I wanted to talk about this paper: gaps.
As many people might know, the fossil record contains some serious lacunas; thick layers of rock containing either very few or no fossils at all. One example mentioned in this paper is the scarcity of fossils from the Oligocene period; very few bones for palaeontologists to gnaw… The Oligocene was, however, a period of massive changes, in climate and all that stuff but also the time when placental mammals evolved from their primitive to modern forms. So the lack of fossils from this time is always frustrating when you want to understand macro-evolutionary patterns. But why have we found so few Oligocene fossils until now? Of the many explanations Stevens et al. suggest that “Possible reasons […] include limited deposits of appropriate age, particularly […] below the equator, complicated by densely vegetated topography in more tropical environments”. And that’s why I find this article so exciting! Traditionally, fossil primates were excavated in deserts or northern latitudes, which is typically where they are fairly rare nowadays! Therefore, I’m happy to see that there is a true effort being made to look for fossils in biodiversity hotspots such as Tarzan’s neighborhood (or the Tanzanian Rukwa Rift Valley in this paper) where these new primates were discovered.
I think one of the most important things to come from this paper is that it’s proof of a real effort to look for the fossils in the true biodiversity hotspots which, I’m sure will lead to far better comprehension of modern mammalian history. These new primates came from Africa but people are also working in Peruvian jungle and interesting new discoveries are not limited to just primates…
On the 15th and 16th April we had one of my favourite events at Trinity College Dublin: the annual School of Natural Sciences Postgraduate Symposium. Over the course of two days many of our PhD students presented their work to the School. We also had two amazing plenary talks from Dr Nick Isaac (CEH) and Professor Jennifer McElwain (UCD). For those of you who are interested in exactly what we work on here at EcoEvo@TCD, here are the abstracts from the PhD student presentations. Check out the TCD website for more details!
Paul Egan: A growing problem − invasive species distribution modelling of Rhododendron ponticum and the implications for conservation.
The invasive alien Rhododendron ponticum is a widely naturalised and problematic weed throughout Ireland, Britain and areas of NW continental Europe. Using invasive species distribution modelling (iSDM) at a fine (2 km) spatial resolution, we examined the bioclimatic and landscape factors which govern the distributional pattern of R. poniticum across the Atlantic biogeographical region compared to its native range in Iberia and the Black Sea region. Good model performance allowed successful prediction of known areas of intense invasion. Model predictions of habitat suitability can help indicate the challenges for local irradication of R. ponticum and therefore help prioritize conservation efforts. Paradoxically, iSDMs generated from the invasive range also provides much needed assessment of the species’ severely restricted native range, where R. ponticum is presently classified as endangered.
Ruby Prickett [@RubyPrickett]: Geographical, ecological and genetic characterisation of perennial biomass grasses.
Evidence suggests that increasing CO2 concentration from fossil fuels in the atmosphere is contributing to global climate change. There is great interest in producing energy from biological sources such as willow (Salix spp.), and the grass Miscanthus. This project aims to contribute to the development of grasses of the C4 genus Miscanthus and several C3 species (Dactylis glomerata, Festuca arundinacea and Phalaris arundinacea) for use as biomass crops, particularly on marginal land. This project aims to produce maps and species distribution models for each of the four species, to identify potential areas for production and their impact on biodiversity; to collect new accessions of Dactylis and Phalaris in the Northwest Europe and Miscanthus in Asia; and to assess the genetic diversity within each species.
Shane McGuinness [@S_Mc_G]: Tourists, farmers and agri-industry: the political ecology of human-wildlife conflict on the margins of a Rwandan protected area. *Highly commended*
As human populations grow, protected areas are put under increasing threat from resource extraction and associated loss of ecosystem services. Furthermore, improved conservation and protection has led to growing faunal populations within these, increasing interactions with neighbouring human populations and reducing support for conservation actions. This is particularly acute where communities bordering protected areas are subsistence farmers. This paper addressed conflict on the margins of Volcanoes National Park, northern Rwanda, through a mixed methods political ecology perspective. Lying in the Albertine Rift Biodiversity Hotspot, it harbours endemic species of primate (mountain gorilla, golden monkey) and significant yet understudied biodiversity, but is bordered by one of the most densely populated regions of mainland Africa. Given the tourism value of this national park and the value of its surrounding land for export-driven agri-industry, the concerns of park-adjacent communities require specific consideration.
Sven Batke: Past hurricanes in predicting present diversity and richness patterns in Cusuco National Park, Honduras. *Best talk 2/2*
High energy weather events are often expected to play a substantial role in biotic community dynamics and large scale diversity patterns but their contribution is hard to prove. I am going to present an overview on how to generate hurricane exposure data at a mesoclimate level for a specific region. Moreover, I am going to present some results that highlight the link between exposure vulnerability and observed tree damage and the potential effect hurricane winds might have on canopy epiphyte diversity patterns.
Vishnu Mohanan [@vmohanan]: Characterisation of lignin and cellulose genes in biomass and energy crops. Sadly Vishnu missed the symposium but we still have his abstract…
Dwindling fossil fuel reserves requires us to look for other sources of energy and emerging bioenergy grasses provides us with an alternative such as Miscanthus, maize, switchgrass and several woody bamboos. Bamboos (subfamily Bambusoideae) have evolved a woody character via enhancement of the lignocellulosic component of vascular tissue, especially vessels. Reeds (e.g. Arundo, Phragmites, subfamily Arundinoideae) and Panicoideae (e.g. Saccharum, Miscanthus, Panicum) have also evolved this trait. It is not known if they have achieved this via alternative biosynthetic paths/genes. Our aim is to first investigate the evolution of genes known to be important for woodiness in grasses (cellulose synthase genes, Cesl, is one such gene family). Secondly, we aim to investigate the effects of woodiness on grass evolution to see if woodiness was a significant key innovation for speciation in the groups that have evolved it.
I’d like to ask the question many paleontologists have to face when they (foolishly) venture out of their museum storage: “So you’re studying fossils right? But what will that bring to the people? A cure for AIDS?”. There are many possible answers from a punch in the face to more mature responses. But I was recently asking myself the question from a biologist’s point of view: “What can biologists really do with the fossil record?”. Well obviously, we can use it to recreate and understand the history of our planet (like in Nature last week) or to do use some nice methods in trying to understand ancient ecosystems. People even might feel lyrical and do some serious work on paleo-poetry! But all of these guys are paleontologists right? They live in their museums and only go out for a movie once every 10 years… How about the other biologists?
Think about it, when ever you’re studying any organism, it is obvious (thanks to this bearded ape) that they had a 3.5 billion year history behind them. Ignoring that might lead to a misunderstanding? As an example, I’d like to use my favorite PhD-presentation example: the crocodiles. When we talk about crocodiles, we automatically think about the few species of big lizard that live in rivers in the tropical/sub-tropical latitudes. But, after a quick look at the history of our planet, the only description that is more or less correct is “lizard” (archosaurians to be more precise). Crocodiles are composed of many species (8 genera today – soon to be 6 – but >70 in prehistoric times) that lived in rivers as much as in the sea, on the ground or even sometimes in trees and in tropical to temperate climates (remains of crocs were found in Normandy – France).
Well maybe that’s just because of this group. But if you think about it, many other groups have ecological or evolutionary features that becomes truly astonishing once you take into account their full history. For my PhD I decided, with Natalie, to look at this fun fact (life existed before yesterday and the people studying it don’t always focus on dinosaurs) through primates. My idea is to combine extant data based on DNA with extinct data based on morphology to have an integrative tree of all primate history. I agree that this sounds a bit too easy and naive, (the method is a bit more complex) and I’ll probably end up with something more humble. However I think the primates can be a good example to illustrate the point about the hidden diversity among extinct groups. The primate fossils are not dramatically different than the extant once (unlike crocs, there were no pelagic primates) but they still show some really interesting features, for the macroecology side, combined extant and extinct primates show massive variation in body mass in some groups (lemurs) but very few variations in others (tarsiers). Or on the macroevolution side, such an integrative tree could provide some further understanding to the old debate of primate origins! Well at least I hope so. For now I’m just comfortable with eating some burgers with a diet coke and a gun in a pickup truck while I’m scanning some primates in the Smithsonian Institution in Washington DC.
“I wish to register a complaint…” the first six months of my PhD have passed by far too quickly. As the date of departure for my first major data collection trip looms, I’m navigating the exciting but unnerving transition from the planning to action stages of my project. Fortunately the members of NERD club were on hand to very kindly listen to my ramblings and provide excellent ideas to add to and modify my research.
Here’s the plan so far…
Evolutionary studies have long-been concerned with understanding patterns of variation in morphological diversity. Two aspects of morphological variation which attract particular interest are convergence – the independent evolution of similar morphologies in phylogenetically distant species – and disparity –the range or significance of morphology in a given sample of organisms.
Morphological variation among tenrecs is particularly interesting – they appear to be both disparate from each other and convergent with other species such as hedgehogs, shrews, moles and otters. However, previous studies have neither quantified the degree of convergence or disparity among tenrecs nor attempted to identify reasons for the occurrence of these patterns. My aim is to fill these significant gaps in our understanding of the evolution of such a fascinating mammalian group.
I work with morphometric data compiled from museum collections of tenrecs and the mammals which they convergently resemble (my data collection involves traveling to museums in London, Washington DC, New York and Boston – oh the trials of PhD life!) I use calipers to take linear measurements and also photograph the species’ skulls and limbs. I use geometric morphometric techniques (this article is a great introduction to the murky world of morphometrics) to statistically analyse the degree of morphological (dis)similarity among tenrecs and other species.
I will plot the morphometric data from my species in a “morphospace”, something similar to Brusatte et al.’s 2008 paper on dinosaur morphology. This graphical interpretation will be useful for measuring both convergence among tenrecs and other species and disparity within tenrecs.
In morphospace plots, morphologically similar species sit closer together than dissimilar species. However, from a convergent evolution perspective these patterns are only interesting if morphologically close species are also phylogenetically distant. I will combine and modify existing approaches (e.g. Stayton 2008 and Muschick et al., 2012) to quantify the amount of convergence among tenrecs and other species and also determine whether tenrecs have evolved a higher degree of convergence than expected by random chance. Similarly, if tenrecs are significantly disparate from each other I expect that the range and variance of their morphological variation will be both greater than random evolution models and also significantly different from their nearest sister taxa, the Golden Moles (e.g. Harmon et al., 2003).
Many texts claim that convergent phenotypes evolve in animals that fill similar ecological niches. However, morphological and ecological convergences don’t necessarily go hand in hand so, while this idea is certainly very plausible in tenrecs, it is important to test the assumption. Fortunately relevant data on physical habitat characteristics, species range maps, life history traits and overlaps with potential competitors and predators are readily available from a range of sources (e.g. PanTheria, LANDSAT and the IUCN) so I can model the ecological similarities among tenrecs and other species. It will be very interesting to determine whether morphological convergence and ecological similarities truly correlate.
So that’s my plan for at least the next six months or so. Interspersed with working in major museum collections while taking a break to tap dance in a parade down Constitution Avenue in Washington DC, I think there are interesting times ahead.
*by parasites here I am referring to all kinds of infectious disease causing agents including bacteria, viruses, fungi, protozoa, helminths and arthropods.
Why do we care about primate parasites?
Many of the most devastating infectious diseases in humans have origins in wildlife. For example, the global AIDS pandemic originated through human contact with wild African primates and influenza viruses circulate among wild bird populations. These are not only historical occurrences. Recently, for example, rodents were identified as the source of a Hantavirus outbreak in Yosemite National Park, USA . As human populations continue to expand into new areas and global changes in temperature and habitat alter the distributions of wild animals, humans around the world will have greater contact with wildlife. Thus, understanding which infectious agents have the potential to spread from animals to humans is crucial for preventing future human disease outbreaks.
Many efforts are being made to collate information on wildlife and human diseases. Much of my research (which I will blog about when I get chance!) uses an amazing database known as the Global Mammal Parasite Database or GMPD for short. Every time a paper is published which contains details of parasites found in either primates, carnivores or ungulates, the information is added to the database. As much data as possible is recorded, including the species infected, the type of parasite, the prevalence of the parasite, and the geographic location of the study. Prof. Charles Nunn and his colleagues have been collecting data for the GMPD since around 2005 and it currently contains around 6000 records for primates alone. This definitely makes it the most comprehensive dataset of primate parasites in existence.
The GMPD sounds amazing…so what’s the problem?
The problem with the GMPD (and this is a feature of virtually all datasets) is that there is sampling bias. Certain primates are sampled for parasites much more frequently than others. Chimpanzees, for example, are sampled for parasites all the time, whereas species such as tarsiers are sampled much less often. This has the effect of making it look like chimpanzees have far more parasites than tarsiers, simply because they have been sampled more often. In analyses using the database we usually deal with this problem by adding sampling effort into our models, so we give less emphasis to high numbers of parasites in primates we have lots of samples for. Unfortunately this problem is also evident when we look at parasites (things like malarial parasites are often sampled because of their importance to human health) and geographic regions (areas with primate research stations are sampled far more regularly than more remote regions). If we hope to use the GMPD data to make reliable predictions about future risks to humans, we need to identify gaps in our knowledge of primate parasites.
So what did you do?
Without going into the technical details, we looked across the primate phylogeny and primate geographic ranges to identify gaps in our knowledge, and used statistical models to investigate what factors led to primates and geographic areas being relatively well- or relatively poorly-sampled. We also used species accumulation curves to extrapolate parasite species richness for primates.
Where are the gaps in our knowledge?
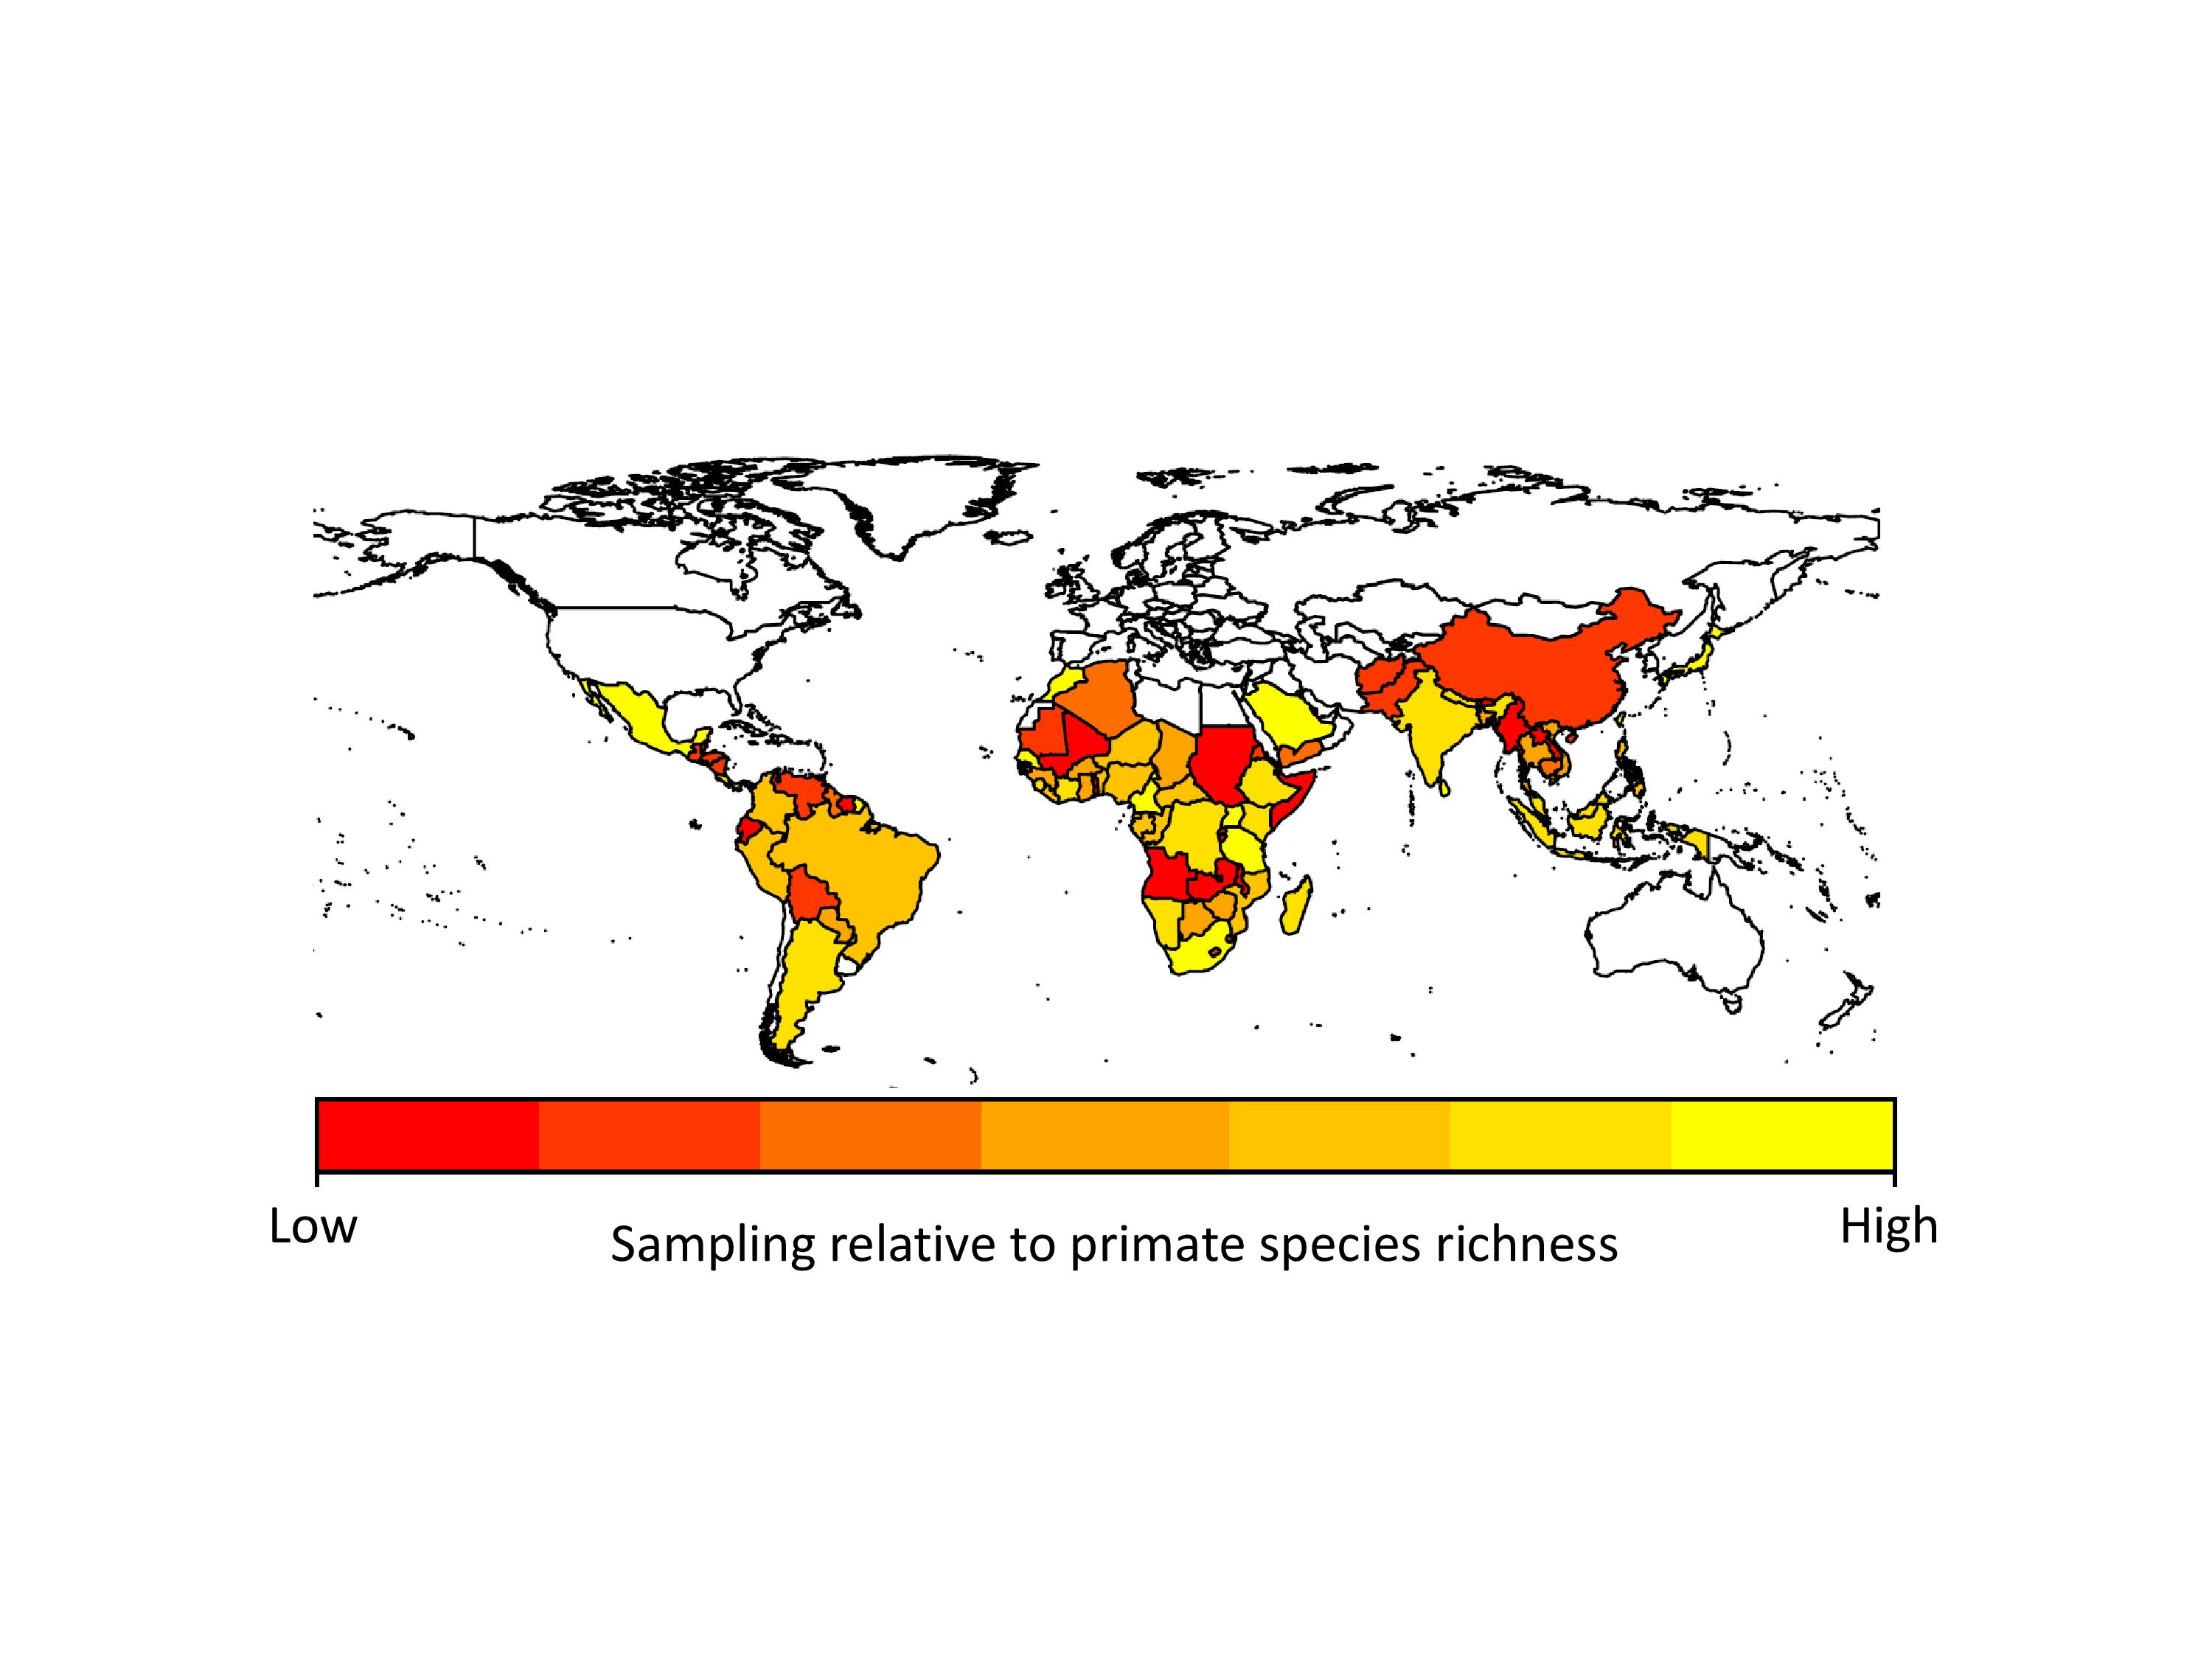
We found that apes (chimpanzees, gorillas and orangutans) were generally better-sampled than other primates, but there was incredible variation in sampling among all other major primate groups. Apart from apes, the primates that researchers appear to sample most are the species they encounter most often, i.e., widespread, terrestrial, diurnal species. However, some primates were sampled more often because they are already intensively studied for other research, because they live in frequently visited field sites, or because of their importance in medical research. Across countries, we found that in general, parasite sampling is highest in countries with more primates to sample. We expected that the GDP of the countries would also affect sampling effort, with wealthier countries having more money for disease monitoring. However, we found no evidence for this in our analyses, probably because most research on primate diseases is not funded by the country in which the research takes place.
Sampling effort for primate parasites across the world. Poorly-sampled countries are in red, and better sampled countries are in yellow.
When we extrapolated parasite species richness values we found that even within our best-sampled primates and countries, we are missing a lot of parasites. On average we predicted that 38-79% more parasite species than currently reported in the GMPD should be found in our best sampled primate species, and 29-40% more parasite species than currently reported in the GMPD should be found in our best sampled countries. This emphasizes exactly how poor our sampling is across all primates and countries. Another concern is that although viruses make up only 12% of the parasites in our dataset, viruses arguably present the greatest zoonotic disease threat to humans because their fast rates of evolution should allow them to easily adapt to new hosts.
What next?
Identifying parasite sampling gaps across primate species and geographic regions is only the first step; we need to find strategies to minimize these sampling gaps if we are to predict which primate diseases may emerge in humans. One solution is to set research priorities based on the sampling gaps, for example, by focusing effort and funding on relatively poorly-sampled primate species, arboreal primates, those with small geographic ranges, or those found in relatively poorly-sampled regions of South East Asia, Central and Western Africa, and South America.
Focusing on relatively poorly-sampled primate species and areas may improve our general understanding of primate parasites, but it is only one factor in predicting risk to humans. For example, hosts are more likely to share parasites with their close relatives than with more distant relatives. Thus, continuing to focus our sampling efforts on parasites of our closest relatives (chimpanzees, gorillas and orangutans) may provide the greatest return in the case of risks to humans. This is particularly important because we found that chimpanzees are expected to have 33-50% more parasites than currently found in the GMPD. In addition, ecological similarities also influence parasite sharing among primates, and humans share more parasites with terrestrial than arboreal primate species. As with sampling effort, this probably reflects higher contact rates among humans and terrestrial primates compared to arboreal primates. As a related issue, a host living at higher density is expected to have higher prevalence of parasites and may have more contact with human populations or our domesticated animals, thus increasing opportunities for host shifts to humans. The large numbers of zoonotic emerging infectious diseases with rodent or domesticated animal sources also highlight the importance of rates of contact and host density for disease emergence in humans.
In conclusion Sampling effort for primate parasites is uneven and low. The sobering message is that we know little about even the best studied primates, and even less regarding the spatial and temporal distribution of parasitism within species. Much more sampling is needed if we hope to predict or prevent future emerging infectious diseases outbreaks.
Recently Science published O’Leary et al.’s – new load of oil to fuel the burning debate on the origins of placental mammals.
Just to be clear: there is an important distinction between mammals in general that includes many fossils from the Jurassic as well as the extant platypus, kangaroo and your grandma; and placental mammals that includes your grandma and the armadillo (but not kangaroos or the platypus) and no fossil before 65Myr. For readers that are not used to the debate concerning the first placental mammal here’s the main question: did the first placental mammals diversify before or after 65Myr (the important KT boundary)?
(1) After Katie
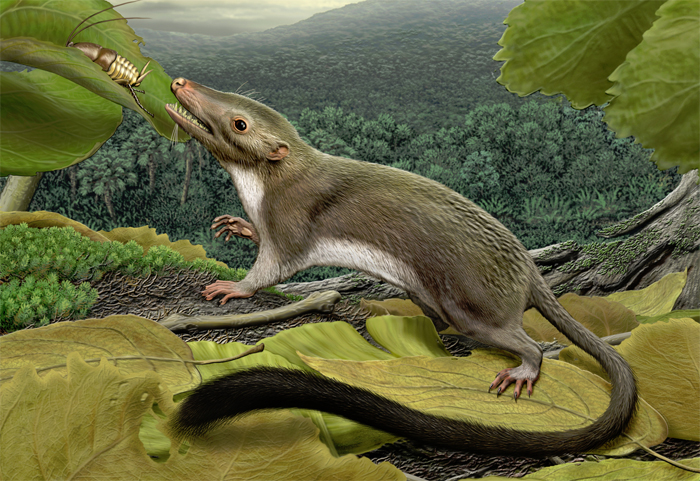
One view suggests that early mammals lived in the shadow of dinosaurs and the demise of these mighty creatures allowed our rat-like ancestors to take over the earth, the seas and the skies “Save yourself mammals”. This idea was proposed by Simpson in the 1950’s and is supported by the fossil record; many dinosaurs (both big and small) were present before the 65 Myr KT boundary, then a catastrophic meteorite impact marked the KT limit and placental mammals radiated after that. This sequence of events seems to be very straightforward but reality appears not to be so simple. Increasing numbers of mammal species from the late Cretaceous are being discovered, (including rather big ones feeding on dinosaurs) and not many species in general are found in the fossil record before 55Myr when all groups of placental mammals seem to suddenly appear (for a full story see Luo’s 2007 Nature review).
(2) Before Katie
In contrast, another group of people, mainly assisted by molecular dating methods, found out that post-KT placental mammalian diversification may just be an artefact of the fossil record (like Meredith et al 2011 in Science again). Their DNA evidence seems to say that placental mammals evolved before the KT limit and that either palaeontologists failed to find them or else the fossil record failed to preserve them. One major criticism that moderate people argue is that there are still problems associated with molecular dating methods. I won’t go into the details (yes I’m trying hard not to) but molecular dating relies on DNA on the one hand (sampling quality and modelling) and on the fossil record on the other hand. So if the people using DNA criticise the fossil record and want to improve the DNA dating estimates, they have to rely on the same fossil record that they are criticising. The snake bites his own tail.
So what about O’Leary and colleague’s paper? They basically support the first theory (placental mammals evolved after KT). Fair enough, it was led by a number of great palaeontologists and based on a massive morphological data set (~4500 characters introduced as phenomics (from the phenotype) as opposed to genomics (from the genome) data) collected on 40 unambiguous fossils and 46 extant placental mammals. Genomic data based on 26 genes of these extant placental mammals was also included. This paper is the result of an impressive and unique collaborative work, but – Ned Stark from Games of Thrones said “nothing someone says before the word “but” really counts” – but this paper is criticisable…
First of all, the data set: although the morphological data is impressive, the taxa sampling effort seems a bit weak, especially for extant placental mammals. Meredith et al used the same genomic data (26 genes) but based on ~164 mammals to answer the same question. Why couldn’t O’Leary use all of this already published mammal DNA? For the second criticism, I’m just going to quote Yoder’s review published in the same issue “Today, sophisticated theoretical and computational methods are used to estimate and calibrate molecular phylogenetic branch lengths (which represent time). Together with improved methods for integrating fossil and molecular data, dates derived from molecular phylogenies have inched closer to those implied by the fossil record. Is the approach used in the O’Leary et al. study directly comparable to these recent molecular phylogenetic studies? Not really, as it turns out.”
No wonder this paper supports the first theory, it is just a precise and massive analysis of the 40 species of the placental mammals fossil record. Personally, I’m really frustrated by how they managed to publish this paper. Since it’s part of my PhD research, I automatically get excited when I see fossils mixing with extant species so I really hoped this paper would link the two approaches instead of supporting the old fashioned view of evolution (the dinosaurs dying and the mammals taking over). I’d like to think that the history of life is a bit more complex and exciting…
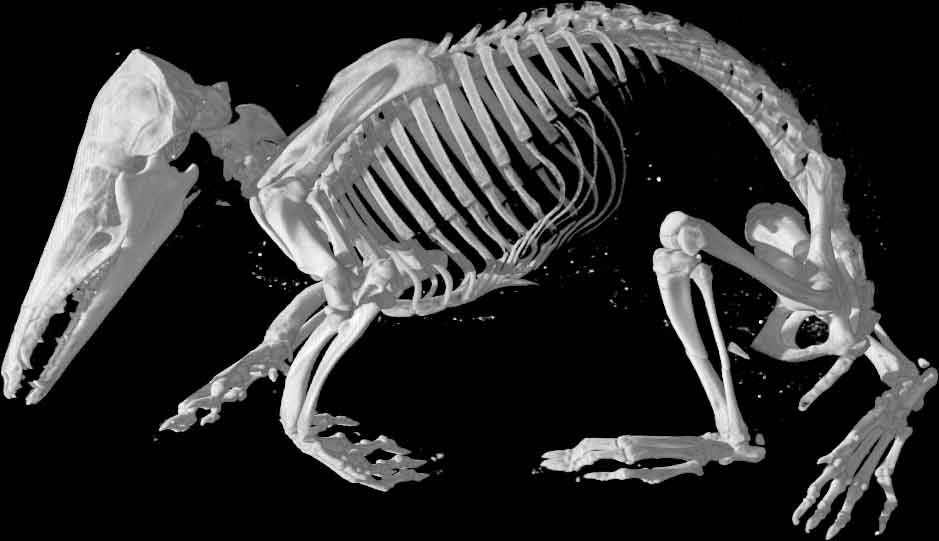
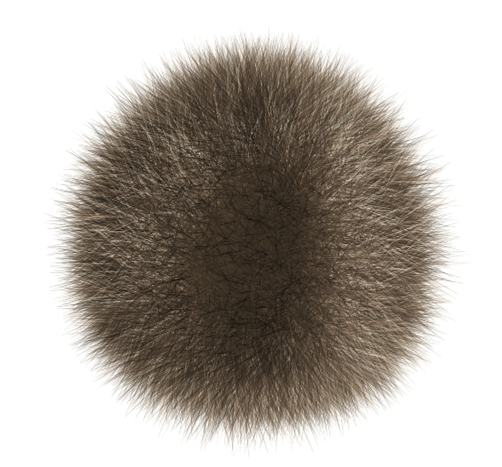
A last comment to justify my title and which will be my main critique to this paper is that O’Leary et al. tried to recreate the “hypothetical placental mammal ancestor”.
As I said, this paper could be seen as a summary of the placental mammal fossil record. So why did they break the first rule that keeps palaeontology away from palaeo-poetry (i.e. going too far with palaeontological hypotheses)? Here they reconstructed a whole creature using their morphological data. What they made was essentially a mean (average) placental mammal (a primitive rat-like creature) – a throw-back to the early stages of palaeontological views of mammalian evolution. What did the ancestor of a duck and a beaver look like? Something in between – a platypus for example? As Olaf Bininda-Edmonds said on Ed-Yong’s Nature post “comparing the two estimates is like comparing “apples and oranges”, they haven’t really done anything to resolve this on-going dispute”.
This paper has also caused controversy on twitter. I’ll just cite two opinions.
Gavin Thomas (@Phalaropus)
“The reconstruction is fun – I’d love to see a picture based on 95% CIs for the ancestral states.”
and Rich Grenyer’s answer (@rich_)
“yes indeed. Something like this” (see our title image).
Many parts of the online science community got excited about this paper, you can see further discussions on Jerry A Coyne’s blog (here and here), on Ed Yong’s one (here and here or there) or else on the twitter feed #placental.
Following the influence of science writers such as S.J. Gould, I always try to look back at the historical perspectives of what I’m studying. These days I’m playing with 3Gb trees so I was delighted by Mindell’s 2013 Systematic Biology publication about the Tree of Life.
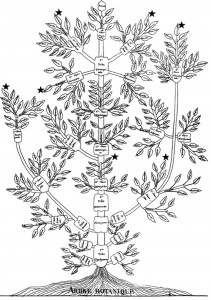
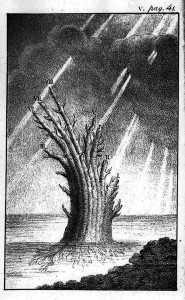
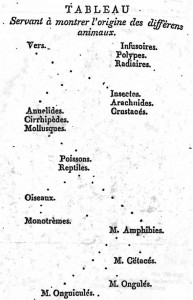
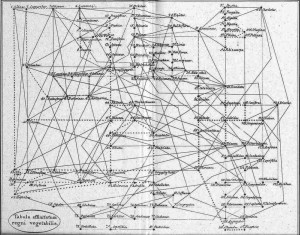
The idea of placing species into the so called Tree of Life emerged before the Origin of Species with works such as Augier’s Arbre Botanique (1801) (Fig. 1) and Eichwald’s tree (1829 – possibly inspired by Pallas’s 1766 work) (Fig. 1). But the spreading of such trees began only after publications of Lamarck’s scheme (1809,Fig. 2), Darwin’s famous sketched drawing (1859 – Fig. 3) and Haeckel’s beautiful tree (1866 – Fig. 2). It is only within an evolutionary framework that these representations of the relationships among organisms make sense: the idea of descent with modification.
Figure 1: Augier’s Arbre Botanique (1801) & Eichwald’s tree (1829) – from Mindell 2013 (Fig.1)
Figure 2: Lamarck’s scheme (1809) & Haeckel’s tree (1866) – from Wikimedia Commons
Figure 3: Darwin’s Origin of Species unique figure (1859) – from Wikimedia Commons
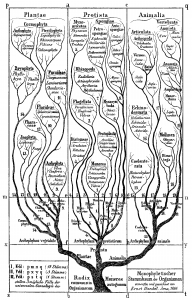
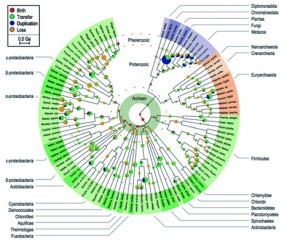
From that point, we all know how the story continued; from Darwin’s sketch (Fig. 3) to modern phylogenomics (fig. 4). Our understanding of the Tree of Life progressed from Simpson’s (this one, not this one) cladistic methods for looking at morphological relations among vertebrates, through to the discovery of DNA, the first molecular clock and, eventually, the use of complicated Bayesian stuff. Depictions of the Tree of Life evolved from something like a cypress (a nice, straight tree with Neil Armstrong at the top surrounded by monkeys and mosses and jelly fish near the roots) to a three-rooted shrub full of immense dead branches near the centre. If you look at the figures included in this blog, the changes in our understanding of the tree are clear: a gradual reduction of anthropocentrism and inclusion of microscopic organisms.
Figure 4: Tree of Life from David and Alm (2011) – from David and Alm 2011 (Sup. Fig. 15)
So what should we do next? Should we just expand the dataset until we have all the species and all their genome plotted in the Tree of Life? Hopefully there are still lots of less boring things left to do for researchers working in this area today… Two questions are (in my mind) really important to look at: is the Tree of Life only the result of descent with modification and what should we put in the tree?
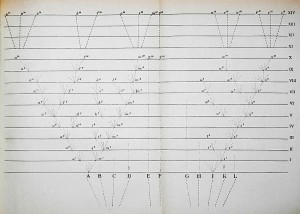
For the first question, it appears more and more clear nowadays that the Tree of Life is not really a tree but rather something along the lines of a tree-shaped web. Regarding Archaea and Bacteria alone (the majority of organisms in the tree), it is estimated that at least 81% of their genes have been laterally transferred among lineages at some time in the past. This phenomenon is also becoming increasingly evident among Eukaryotes (even among vertebrates!) and recognition of these events should lead to a more web-shaped “Tree” of Life. Incidentally, it is interesting to note that Batsch recognised this web structure in plants as early as 1802 (Fig. 5).
Figure 5: Batsch’s web of plants (1802) – from Mindell 2013 (Fig.1)
Regarding the second question, asking what can be included in the tree of life comes down to how we determine what is living. I remember one question that a classmates had in my phylogenetic lectures; “What is the out group of the tree of life?” The lecturer had just said that a tree without an out group is not valid. The resulting discussion turned into a really long (and interesting) debate about viruses – the question being whether we should put the viruses in the tree of life? We might define living organisms by entities that can replicate their own DNA. So you could argue that if viruses cannot achieve this independent replication then we should prune them out of our tree. Haha ! But wait, it’s not so easy: although most viruses require host cells for reproduction, so do many other “living” organisms like Richettsia or Chlamydia. In addition, some viruses have many genes involved in DNA replication so how should their self-replication abilities be classed ?
Mindell conclude by quoting Brooks and van Veller (2008): “There are two choices. Do we classify a tree with [lateral transfers], or do we try to classify a [lateral transfer] network? If we wish our classifications to reflect what we think we know about evolution, it seems that we will have to opt for the first alternative.” Does this mean that we should go for a tree shaped web including viruses? Let see how the debate will go on…
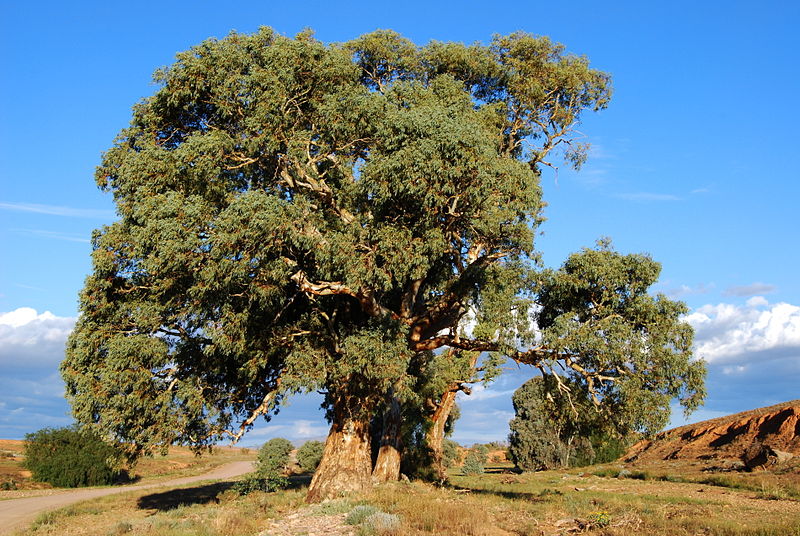
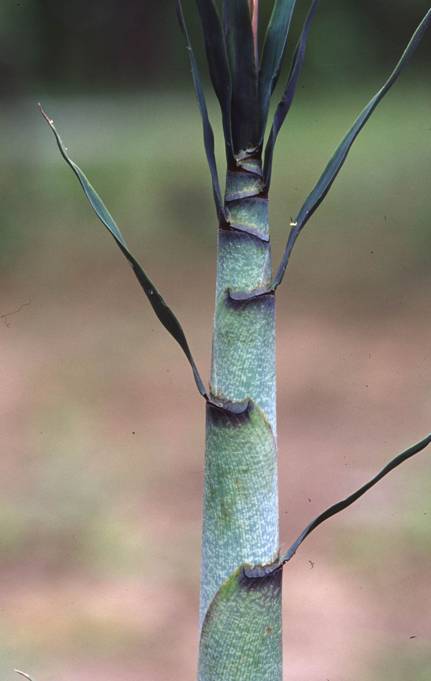
Young shoots of Phuphanochloa Sungkaew & Teerawat.: a new species and genus of woody bamboo discovered by TCD botanists.
The bamboos are an extraordinary group of plants and the only large group of grasses to diversify in forests. They represent a major radiation in the angiosperms with nearly 1,500 species. The Bamboo Phylogeny Working Group (including TCD botanists Sarawood Sungkaew and Trevor Hodkinson) have recently used molecular, anatomical and morphological characters to update the tribal and subtribal classification of bamboos including the new genus (Phuphanochloa) shown in the photo.
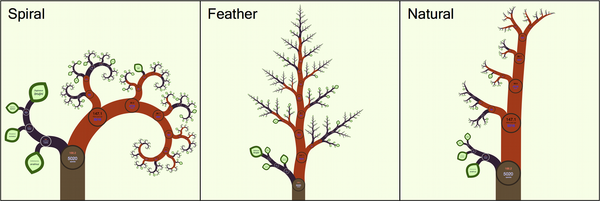
Visualising the tree of life is a challenge for even the most artistically attuned in the scientific community. The problem is the sheer number of species that we need to represent, literally millions. But I think the latest attempt meets the challenge. The developers of OneZoom, the name of the new approach, argue that we need to escape the “paper paradigm”. We should instead make full use of the benefits that digital interactive displays grant us. Worrying that our efforts won’t translate to the printed page is an exercise in Luddism.
So, why is OneZoom so successful? The display takes its cues from Google Earth, the virtual globe, but whereas in Google Earth you move from continents to countries in OneZoom you zoom in from class to species. It’s even better than that because the whole tree has a fractal geometry, the self similar patterns you can see with real trees, which allows for an intuitive zoom function. One critique is that the fractal geometry ends up displaying the groups that diverged earlier (e.g. monotremes) as larger than the more recent groups (e.g. placentals), suggesting some significance when there is none. So far only the mammals are on show but it’s early days yet.
There are a number of other really useful features like the ability to play the evolution of the whole tree backwards and forwards in time so you can see exactly when a given species, genus or what have you, diverged. The potential for science communication as well as research is great. But enough of me talking about what is best seen and check it out for yourself. The details of OneZoom are available in PLOS Biology.
Author
Adam Kane: kanead[at]tcd.ie
Photo Credit
Rosindell J, Harmon LJ (2012) OneZoom: A Fractal Explorer for the Tree of Life. PLoS Biol 10(10): e1001406. doi:10.1371/journal.pbio.1001406
Grasses rank among the world’s most ecologically and economically important plants including wheat, barley, rice and maize. Evolution of the C4 syndrome has made photosynthesis highly efficient in about half of their species, inspiring intensive efforts to engineer the pathway into C3 crops to improve drought and heat tolerance. An international collaboration called the Grass Phylogeny Working Group (including Trevor Hodkinson, TCD) produced one of the most comprehensive phylogenetic trees of the grasses and used this to show how C4 evolution has evolved. Results published in the journal New Phytologist show that it has evolved repeatedly 22-24 times and within two groups in particular.


