A recipe for collaboration


Recently, along with Adam Kane, Kevin Healy, Graeme Ruxton and Andrew Jackson, we published a review on scavenging behaviour in vertebrates through time in Ecography.

This paper was my first review paper as well as my first paper written from afar, without ever actually meeting in a room with the co-authors for working on the project.

Difficulty: *

Preparation time: 5 month to submission

Serves: 5 people (but any manageable number of people who you like working with will do)

Ingredients:

  • An exciting topic:

For this recipe you will need an exciting topic.

In this case, prior to writing the review, we had often discussed the prevalence of scavenging behaviour through time and what ecological factors influence it.

Indeed, it came as a natural follow up to a paper published by the other co-authors earlier this year on ‘the scavenging ability of theropod dinosaurs’.

More generally, the topic should be broad enough to allow every person to look for anecdotes (did you know there was once a ‘scavenging bat called *Necromantis*?’ and to bring these together in an interesting, more generalised framework. Continue reading “A recipe for collaboration”

Ecology & Science in Ireland: the inaugural meeting of the Irish Ecological Association

In the years to come, 140 ecologists working in Ireland will look back with fond memories of being part of the inaugural meeting of the Irish Ecological Association (24th-26th November). We will remember hard-hitting plenaries, compelling oral presentations, data-rich posters, influential workshops and the formation of the IEA’s first committee. The lively social events might be harder for some of us to remember… Continue reading “Ecology & Science in Ireland: the inaugural meeting of the Irish Ecological Association”

The Skeleton in the Closet

IMG_1618

After a few ups and downs, everything you always wanted to know about the effect of missing data on recovering topology using a Total Evidence approach is now available online (Open Access)!

This paper also treats many different questions that people might be interested in (Bayesian vs. ML; how to compare tree topologies; comparing entire distributions, not only their means and variance; and many more!) but I’ll leave it to you to discover it…

Back on track, more than one an a half CPU centuries of calculation ago, Natalie and myself wanted to build a Total Evidence tip-dated primates tree. The Total Evidence method is the method that allows you to combine both living and fossil species (or actually, read “both molecular and morphological data”) into the same phylogenies. The tip-dating method, is an additional method that uses the age of the tips rather than the age of the nodes for dating such a tree. But I’m not going to talk about that in this post.

At the start of the project, we were both confident about the idea behind it and that primates would be the ideal group for such work since they are so well studied. A study that I described in a former post also came out around the same time, encouraging us and comforting us in this project.

However, as you might guess, something went wrong, horribly wrong! For the Total Evidence method, we need molecular data for living species (check) morphological data for fossils species (check) and also for living species (che… No, wait)! After looking at the available data, we quickly found out that there was a crucial lack of living taxa with available morphological data (check our preprint to be submitted to Biology Letters putting the actual numbers on the problem). From that problem, rose the idea of actually testing how that would influence our analysis. And funnily enough, this problem become one of the two major parts of my PhD!

Running thorough (and loooooong) simulations, we assessed the impact of missing data on topology when using a Total Evidence method. We looked at three parameters where data would be missing:

  1. The first one, was obviously the one I introduced above: the number of living taxa with no available morphological data (at all!).
  2. The second one, was the amount of available data in the fossil record (because yes, fossils can be a bit patchy).
  3. And the third one, the overall amount of morphological characters.


We then compared the effect of different levels of available data for each parameter individually and and their combination on recovering the correct topology, using both Maximum Likelihood and Bayesian Inference. For the correct topology, we used the tree that had no missing data in our simulations. For each parameter combination, we measured the clades in common between the correct topology and the trees with missing data as well as the placement of wild-card taxa (typically fossils jumping everywhere).

Unsurprisingly, we found that the number of living taxa with no available morphological data was the most important parameter for recovering a good topology. In fact, once you go past 50% living taxa with no morphological data, the two other parameters have no effect at all, even if you have a perfect or a really bad fossil record or many or really few characters. This is kind of intuitive when you think about it because the only way to branch the fossils to living taxa is to use the morphological data. Therefore, if there are no morphological data for the living taxa, the fossils cannot branch with them regardless of the quality of the data. Therefore, in this paper, we argue that to improve our topologies in Total Evidence, we should visit more Natural History museums. And not only the exciting fossil collections but the well curated collections of living species as well!

All the code for this paper is available on GitHub.

Check out the latest presentation about both papers.

Paper 1: Guillerme & Cooper 2015 – Effects of missing data on topological inference using a Total Evidence approach – Molecular Phylogenetic and Evolution (doi:10.1016/j.ympev.2015.08.023).

Paper 2 (preprint):  Guillerme & Cooper 2015 – Assessment of cladistic data availability for living mammals – bioRxiv ().


Author: Thomas Guillerme, guillert[at]tcd.ie, @TGuillerme

Photo credit: Thomas Guillerme (AMNH collections)

Do you speak Yamnaya?

Pieter_Bruegel_the_Elder_-_The_Tower_of_Babel_(Vienna)_-_Google_Art_Project_-_editedI bet you do!

One nice non-biological thing you can do with phylogenetics (unlike beers) is study the evolution of languages. If you aren’t familiar with evolutionary linguistics, it’s basically the same principles that we use to study the descent with modification of organisms but applied to words. Even though words do not evolve in a biological way, we can still apply similar phylogenetic principles by just adjusting the evolutionary models.

OK but let’s go back to my assumption (that you do speak Yamnaya). Since you are reading this blog post that I’m trying to write in English, you do speak English which is part of the linguistic family (or clade) called the Indo-European that consists of the vast majority of the European and Indian languages spoken by a good 3 billion people (as the name originally suggests- check this excellent visual phylogenetic summary). Even though it is not straightforward to see the similarities between Icelandic and Indi, evolutionary linguistics suggest that both languages have diverged from the same language based on words and grammar similarities. This language, generically called proto-Indo-European is estimated to have originated either around 9000 years ago in the Middle-East and spread across India and Europe along with agriculture (the ‘Anatolian hypothesis’). Or, a second theory postulates its origin around 5000 years ago on the northern shores of the Black Sea and its subsequent spread along with horse riding and wheeled transport (the ‘steppe hypothesis’).

Until last month, both hypotheses were lacking data to explain some crucial temporal problems: the proto-Indo-European language contains words related to wheeled vehicles which were not invented 9000 years ago therefore potentially falsifying the ‘Anatolian hypothesis’. However, DNA studies did support it with a common ancestral population to Indo-European speakers dated around 9000 years ago. Also on the DNA side, no clear evidence for population dispersion was available for supporting a later origin and faster spread of the proto-Indo-European (the ‘steppe hypothesis’).

But that was only until this month: a recent paper by Haak along with his 39 co-authors preprinted in BioRxiv provides evidence for a common ancestral population that originated in the Ukraine and spread at into northern and western Europe. This population links in space and time with the Yamnaya culture around 4000-5000 years ago suggesting that Yamnaya was close to the proto-Indo-European culture. Even though if the ‘Anatolian hypothesis’ cannot be excluded, this new paper strongly suggests that at least the European branch of the Indo-European language originated from the Yamnaya culture (see Extended Data Figure 5 p.32 and its legend p.27 of the preprint pdf for a nice visual summary).

Therefore it is likely enough that Yamnaya was the origin of most European languages and that it spread rapidly through northern and western Europe probably due to technical advancements in transport. I find evolutionary linguistic always amazing when you can state that you wrote/read a blog post in a derived Yamnaya language: English.

Author: Thomas Guillerme, guillert[at]tcd.ie

Photo credit: wikimedia commons

The more the better?

birds-of-paradise

These days I’m writing up the discussion of my sensitivity analysis paper on missing data using the Total Evidence method (more about it here and here). One evident opening for proposing future improvement on my analysis is the obvious “let’s-do-it-again-with-more-data” one… But a recent Science paper by Jarvis et al made me reconsider that. Is more the always better?

Jarvis and his numerous colleagues just published one of the biggest bird phylogenies that contrasts with the previous reference one (by Jetz et al in Nature). In Jetz’s paper, the authors were interested in the relations among modern birds (read “non-dinosaurs ones”) and tackled the question by trying to sample the whole of bird biodiversity (9,993 species!). However, as in most analyses of this kind, the molecular data can be fairly poor (note that they still managed to collect a maximum of 15 genes for 6663 species). Even though the global picture of avian diversity is clear, some regions are less resolved than others and an obvious way to fix that would be to sample more genes per species. And that is, in a way, exactly what Jarvis and his colleagues tried to achieve.

In this new study, the authors went on sampling not 15, 70 or 150 genes but 8251 genes per species! This led to a really deep and long analysis – over 400 CPU years, and I thought 150 was long! – of the complete genome of birds. By the way, they use the name Total Evidence nucleotide tree (TENT) to design the results of their analysis which is pretty confusing since a total evidence tree means something quite different to me. But that’s just a semantic rant. Using this massive TENT, the authors fixed some previously poorly resolved nodes, redefined the names of ancient divergences among birds (with the Passerea – tits and relatives – and the Columbea – pigeons and relatives), demonstrated an explosive (“big-bang”) radiation after the K-T event and determined the patterns of certain traits evolution (such as raptoriality or vocal learning). In short a thorough work that allowed the authors to say: “The conflict we observe with other data types can no longer be considered to be due to error from smaller amounts of sequence data”. I feel that writing something like that in a paper is a nice achievement!

However – don’t get me wrong, this paper is yet a great example of collaborative work and insight in new methods – the sample size is… 45 species. In other words, Jetz et. al sampled 100% of the species but less than 1% of the data as for Jarvis et al., they sampled 100% of the data for less than 1% of the species. In this case, we have two extreme views of the same question (“how did avian diversity evolve?”) and in both cases, I think the macroevolutionary claims are weakened by the number of species or the amount of data… However, from a practical point of view, I think the method that included more species will be preferred by researchers since their species of interest are more likely to be present in that tree. What’s the best balance? Full genome or full sampling? I’ll leave it to you to decide…

Author

Thomas Guillerme, guillert[at]tcd.ie, @Tguillerme

Photo credit

http://everythingbirdsonline.com/

A Rose by Any Other Name

Carl Linnaeus has a lot to answer for. As a young medical student he became obsessed with botany, then a necessity as most medicines were derived from plants. At the time the naming of plants was a rather haphazard affair, some names were given to multiple plants, others could be many words long. It all made for great confusion and difficulty disseminating information. In an attempt to manage the situation, in 1735 he published the first edition of his masterpiece of classification, the Systema Naturae. Most people remember this book as being the first time that plants were classified according to the now familiar Kingdom, Class, Order, Genus and Species (family was a later addition). What they sometimes forget is that it was also the first time that plants, and later animals, were given a standardised binomial designation.  This was a revolutionary idea and quickly came to dominate the literature and is still in place almost 300 years later. Continue reading “A Rose by Any Other Name”

Hopsolete Trees

Beer_bottles

One of the most unusual benefits of being in Ireland from a Southern French PhD student’s perspective is not so much the rain and the pronounced taste for culinary oddities (some weird, some excellent) but the awesome trend towards a new age of craft beers (and I’m not mentioning the pillar of Irish pub culture). Looking at the increasing beer richness available in any decent pub/off-licence, I was inspired to combine two of my passions: beer-related stuff and phylogeny-related stuff. Despite an honourable attempt by J.L. Brown, I would like to discuss the three reasons why it’s imphopsible to build a true beer phylogeny. Admittedly one of the main reasons for this impossibility is the side effect of drinking any sugar rich (at least originally) drink that has been infected by Saccharomyces cerevisiae… But there are also three more theoretical reasons. Continue reading “Hopsolete Trees”

School of Natural Sciences Postgraduate Symposium 2014: Part2/4

Trex

On the 20th and 21st of February we had our annual School of Natural Sciences Postgraduate Symposium. Over the course of two days many of our PhD students presented their work to the School. We also had two interesting plenary talks from Dr Sophie Arnaud-Haond (Ifremer) and Dr Lesley Morrell (University of Hull). Unfortunately our third speaker, Dr Fiona Jordan (University of Bristol) had to cancel due to illness.

For those of you who are interested in exactly what we work on here at EcoEvo@TCD, here are the abstracts from the PhD student presentations. Check out the TCD website for more details!

Aoife Delaney: Eco-hydrology of humid dune slacks*

*Highly commended

Dune slacks are hollows in coastal sand dune systems where the groundwater table is close to the surface. Many dune slacks flood in winter to form temporary ponds which can last from a few weeks to several months. Humid dune slacks are an Annex I habitat (2190) and in accordance with Article 17 of the Habitats Directive they have been mapped and assessed in Ireland on the basis of their vegetation. During monitoring in 2013, Humid dune slacks (2190) were assessed as Unfavourable-Inadequate and topics for further research were identified. The extent and effect of water abstraction and wastewater from recreation facilities has not been firmly established in Ireland, and work relating biological communities to water quality or depth and duration of flooding has focussed almost entirely on vegetation up until now.

This project will assess variation in vegetation, mollusc and water beetle communities present in dune slacks in Donegal, Mayo, Kerry and on the east coast. It will also investigate the effects of land management by comparing biological communities of sites which are under different management regimes such as extensive pasture and golf courses. The hydrological functioning of dune slacks will be related to biological communities they support.

Anne Dubearness: Systematics of the genus Embelia Burm.f. (Primulacae — Myrsinoidae)*

*Highly commended

Primulaceae subfamily Myrsinoideae is a species-rich tropical group containing over 2000 species, with several taxonomically difficult genera with poorly defined limits and many novelties needing description. Within the subfamily, Embelia is a genus of climbing shrubs distributed mostly in South and South-East Asia and tropical Africa. The last monograph of this genus (made by Mez in 1902) recognised 8 subgenera and 92 species, but the total number of species is currently estimated at 140. The systematics of this group needs investigation using a modern phylogenetic approach: indeed, Embelia displays extensive morphological variation (especially regarding the position, shape, size and merosity of the inflorescences) and is only distinguished from other Myrsinoideae by a climbing habit and distichous leaves. This project aims to combine molecular and morphological data in order to investigate the systematic of Embelia at 3 levels: first of all the monophyly of the genus must be tested, then the existing subgenera must be assessed and refined in order to produce a taxonomic framework of the genus, and the final focus will be on the subgenus Euembelia Clarke, which contains more than 65 species and could certainly be split into several sections.

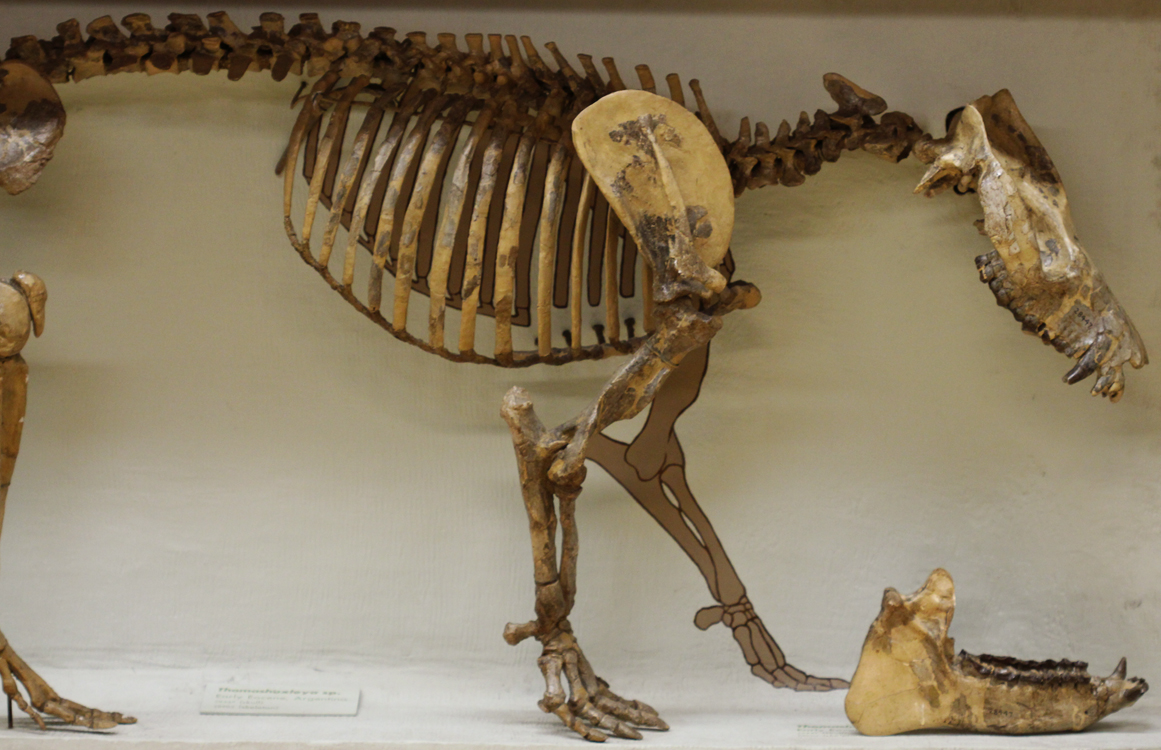
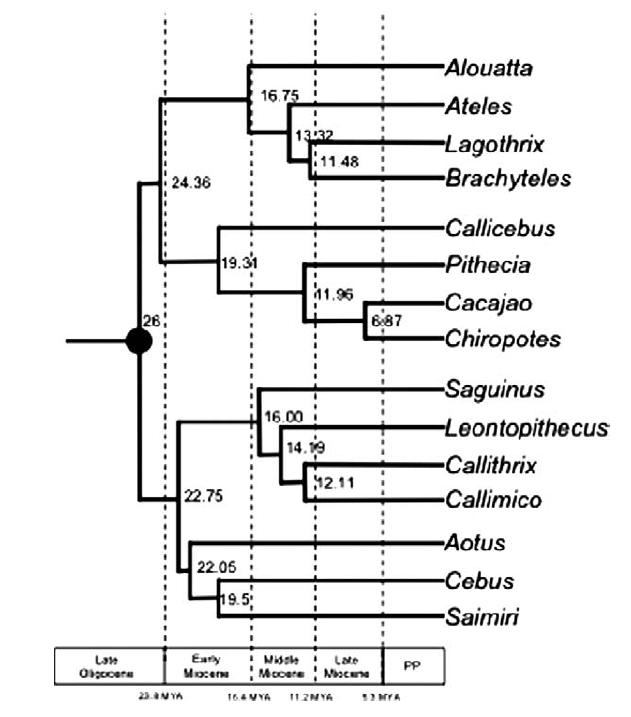
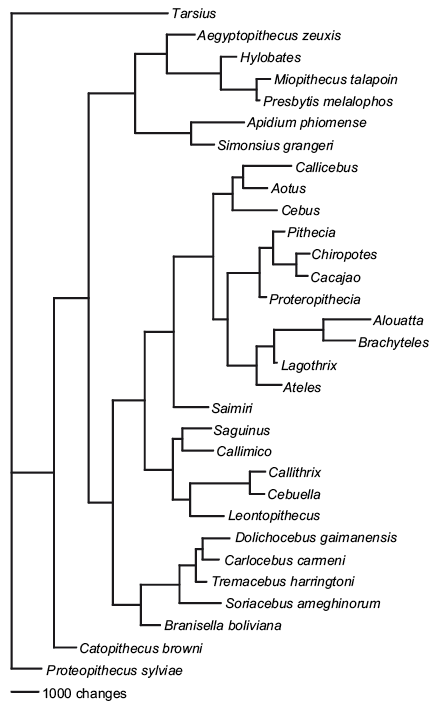
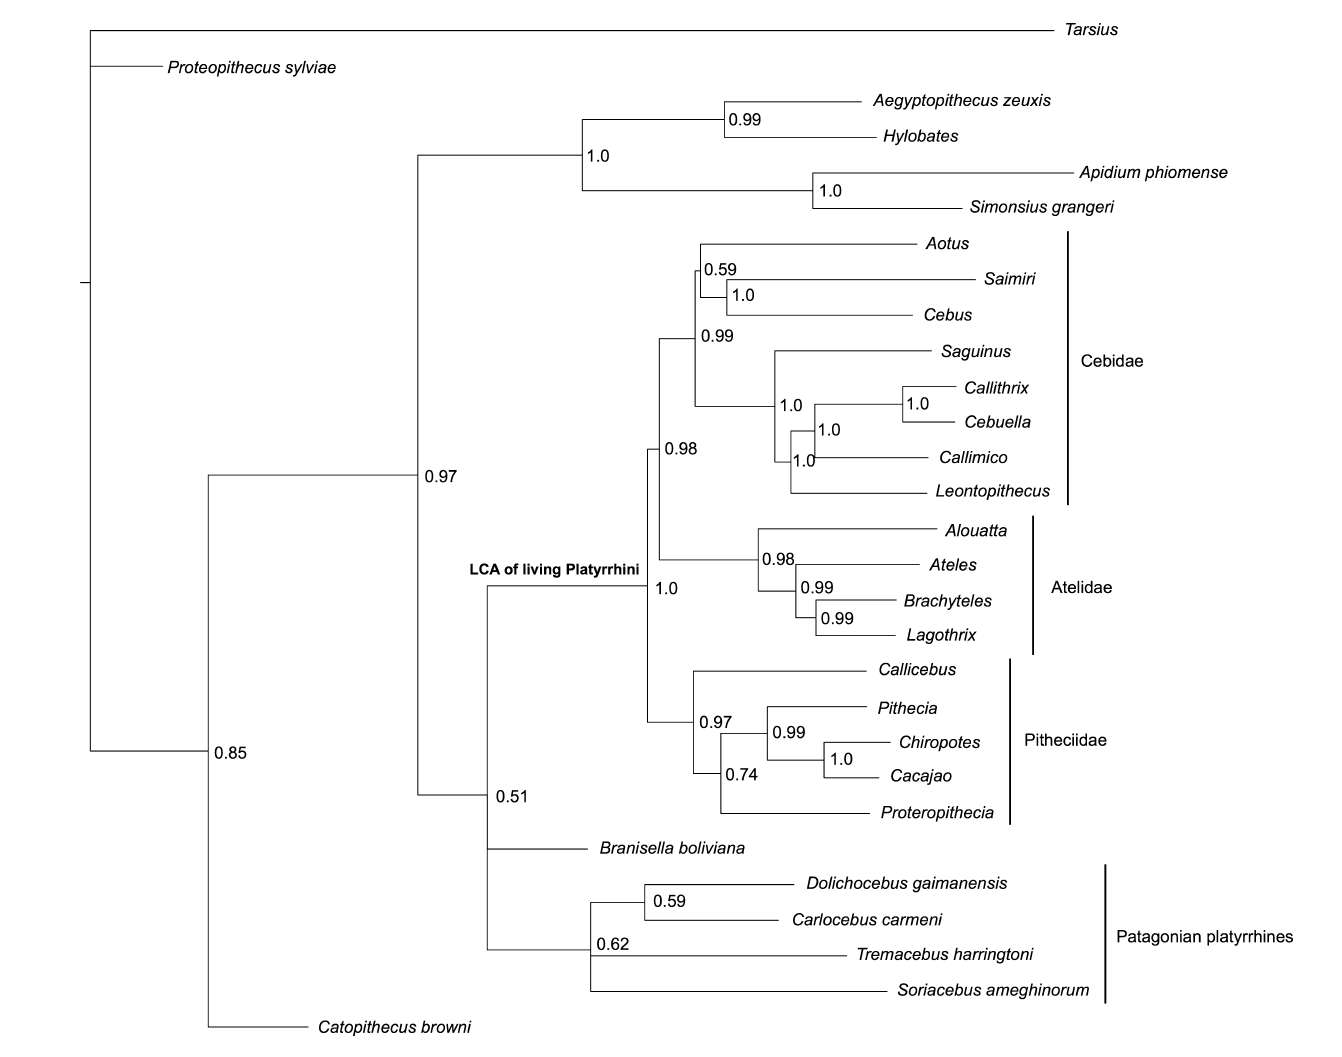
Thomas Guillerme: Combining living and fossil taxa into phylogenies: the missing data issue*

*Highly commended

Living species represent less than 1% of all species that have ever lived. Ignoring fossil taxa may lead to misinterpretation of macroevolutionary patterns and processes such as trends in species richness, biogeographical history or paleoecology. This fact has led to an increasing consensus among scientists that fossil taxa must be included in macroevolutionary studies. One approach, known as the otal evidence method, uses molecular data from living taxa and morphological data from both living and fossil taxa to infer phylogenies. Although this approach seems very promising, it requires a lot of data. In particular it requires morphological data from both living and fossil taxa, both of which are scarce. Therefore, this approach is likely to suffer from having lots of missing data which may affect its ability to infer correct phylogenies. Here we assess the effect of missing data on tree topologies inferred from total evidence supermatrices. Using simulations we investigate three major factors that directly affect the completeness of the morphological part of the supermatrix: (1) the proportion of living taxa with no morphological data, (2) the amount of missing data in the fossil taxa and (3) the overall number of morphological characters for all of the taxa.

Florence Hecq: Effects of scale and landscape structure on pollinator diversity and the provision of pollination services in semi natural grasslands

Over recent decades, humans have been changing the environment more rapidly than in any other period of history. Technological advances and new agricultural policies have led to a simplification of landscape structure resulting in the loss and fragmentation of habitats for flower-visiting insects which play an important ecological role as pollinators. Pollinating insects are very mobile and are influenced by the availability of flowers and nest sites over a scale of several kilometres.

In this study, we investigated the effects of the complexity of landscape structure on the diversity of four pollinating taxa and on the provision of pollination services to four plant species. Pollination data were collected in 19 semi-natural grassland sites in north midlands region of Ireland and related to the composition and configuration of surrounding landscape at two spatial scales (500m and 1km radius around sampling sites). Landscape structure was characterised by digitising each landscape feature with aerial photographs and GIS, and then ground-truthed using field-based surveys. Knowledge of these pollination/landscape scale relationships is crucial for a better understanding of pollinator diversity patterns and should be helpful for future conservation management decisions; ensuring essential levels of pollination services to wild plants are maintained.

Lindsay Hislop: Does nutrient enrichment moderate the effect of water level fluctuations on littoral communities?

Freshwater abstraction from lakes in order to support a growing human population is rapidly becoming a major global stress on lacustrine ecosystems. The consequent amplification of water level fluctuations disproportionately impact lake littoral zones, which contain the majority of their biological diversity. However, remarkably little is known about the impacts of amplified water level fluctuations on littoral assemblages and less still is known about how they interact with nutrient enrichment, one of the most pervasive and important of human disturbances on the biosphere. To address this, we established an experiment in large outdoor pond mesocosms where we quantified the effects of water level fluctuations and nutrient enrichment, both separately and together. We found that the impacts of water level fluctuations on both primary producers and benthic consumers varied significantly along the depth gradient. However, we found no interactions between nutrient enrichment and water level fluctuations. Given that the problem of amplified water level fluctuations is likely to be exacerbated considerably by predicted increases in climatic variability and enhanced water demand, our findings have profound implications for the conservation and management of global aquatic biodiversity.

Nuria Valbuena Parralejo: The impact of artificial sub-surface drainage on greenhouse gas emissions, change in soil carbon storage and nutrient losses in a grazing cattle production system in Ireland

In Ireland, over the 33% of milk is produced on a Heavy Soils farms. Heavy Soils are characterised by low permeability and often form in high rainfall areas. The combination of both can lead to waterlogging, promoting soil compaction which significantly affects the grass production. Drainage has been shown as an effective tool for improving the soil permeability. Little data is available to assess the effect of the artificial subsurface drainage of a grassland production system, on greenhouse gas emissions, change in soil carbon storage and nutrient losses. This experiment will be carried out in Teagasc Solohead Research Dairy Farm (latitude 52° 51’ N, 08° 21’ W; altitude 95 m a.s.l.). Different treatments (i) mole drain winter, (ii) mole drain summer, (iii) gravel mole and (iv) control were imposed in one site of the farm in 2011. A new experiment will be set up at a different site on the farm in summer 2014 with (i) control and (ii) gravel mole into collectors. Nitrous oxide (N2O) flux measurements, soil respiration measurements, soil total carbon and total nitrogen analysis, soil nitrogen mineralisation and net nitrification, water analysis, water table measurements and herbage production will all be perform in both sites over two years.

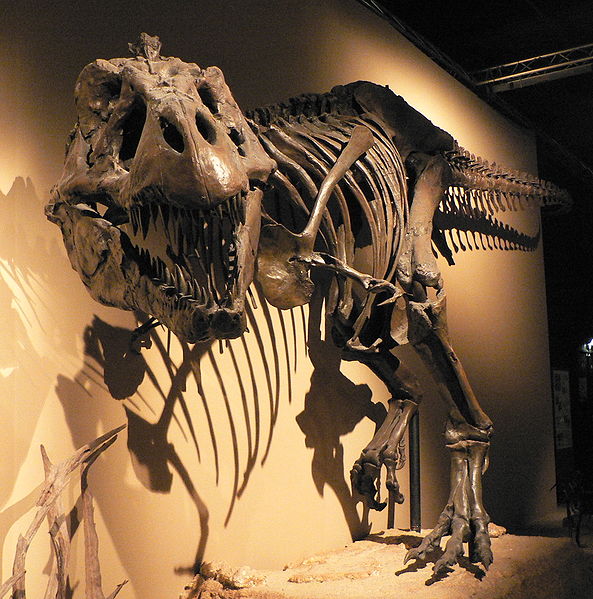
Adam Kane: Ontogenetic dietary partitioning in Tyrannosaurus rex*

*Highly commended

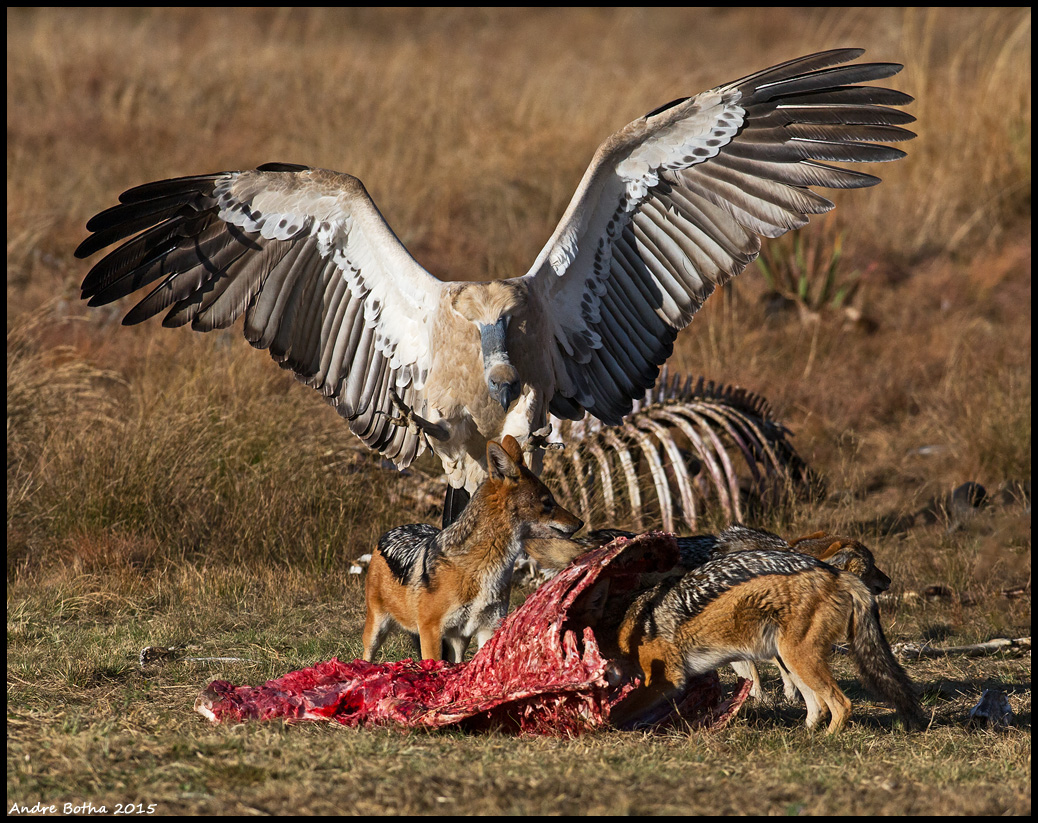
Obligate scavenging in vertebrates is a rare mode of life, one which requires very specialized morphologies and behaviours to allow the scavenger to cover enough area to find sufficient carrion. Yet, a number of studies have suggested that Tyrannosaurus rex occupied this niche with others arguing for its role as an apex predator. In this study we move away from the polarised predator-scavenger debate and argue that T. rex underwent an ontogenetic dietary shift, increasing the proportion of carrion in its diet as it aged due to both the increased availability of carrion through direct intraspecific and interspecific competition and also by exploiting resources unavailable to its smaller competitors, namely bone. We follow an energetics approach in our study to explore the effect of this previously unrealised resource on the ecology of T.rex and look at the impact of the proposed ontogenetic dietary shift.

Image Source: Wikicommons

A brave new world of monkeying around with trees

Tamarin_portrait_2_edit3

I’ve spent the last few days writing an introduction for my first PhD paper on the practical issues of adding fossils to molecular phylogenies (full recipe here). This is my starting point: most people working in macroevolution agree that we should integrate fossils into modern phylogenetic trees. Of the many possible methods that are available, Ronquist’s total evidence method looks to be the most promising (however, some nice other ones also exist).

Recently Schrago et al. published a nice attempt to use this method on the Plathyrrini (New-World monkeys to you and me):

As a reminder, the aim of this total evidence method is to combine all of the available data: both molecular and morphological. Traditionally, analyses have treated each type of data separately; approaches which bring their own advantages and problems.

Let’s start with the molecules:

Opazo et al. published in 2006 a classical example of a molecular phylogenetics study. There are more recent, impressive phylogenetic studies (like Perelman et al. in 2011 and Springer et al. in 2012) on most of the primates and using more genetic data but I think Opazo is a better example of a traditional approach because it involves a tree with 17 taxa instead of more than 200.

Opazo.et.al~2006-Fig5
Opazo et al. 2006 Fig. 5. A Platyrrhini dated phylogeny – values indicate the age of the nodes, the circle at the root of the tree is the fossil used for age calibration: Branisella.

Two of the main advantages of this approach are the quantity of data involved (tens of thousands base pairs) and the methods of inferring the evolutionary history: molecular evolutionary models are easy to understand and easy to implement (each site has a finite number of states – A, C, G, T or nothing – and probabilistic models are good enough to infer the rate of changes from one state to the other). From a data perspective, another  practical advantage is that, with modern NextGen sequencing, it’s really easy and fast to obtain a full genomic dataset. However, the main inconvenience from a macroevolutionary point of view is that molecular approaches don’t really take evidence from the fossil record into account. In the Opazo example, the only fossil used is Branisella, and the only useful information here is just its age (around 26 Ma) used to calibrate the time on the tree.

On the other hand, Kay et al. 2008 published an awesome study of the Platyrrhini history from a palaeontological point of view. They focused on 20 living taxa combined with 11 fossil species and using 268 morphological characters.

Kay.et.al~2008-Fig21
Kay et al. 2008 Fig. 21. A Platyrrhini phylogeny based on morphological data including fossils.

Again, there are both advantages and problems associated with this approach. Firstly, the number of characters used is pretty low; don’t get me wrong, 268 is really good for a morphological matrix, it’s just low compared to molecular data. Furthermore, the underlying evolutionary models used to build the phylogeny are hard to infer, the most common model is the Lewis 2001 Mk model where morphological characters are treated as if they  “act like” molecular sites with no assumptions made about their states or rates of change (this method has been criticized but it’s still our best way to infer morphological evolution). Another solution, which is also commonly used, is to infer nothing but instead just use a maximum parsimony approach: find the tree which explains observed phenotypic evolution with the fewest number of evolutionary steps (characters changing from one state to another on a particular node within the tree). However, compared to a purely molecular approach, the advantages of Kay’s tree are clear from a macroevolutionary point of view: this tree includes full information from the morphologies of both living and fossil species!

Now hopefully you can see where I’m coming from in wanting to use the total evidence method? It’s clear from the empirical examples above that the problems associated with one approach are the advantages in the other. So let’s just combine them! And that’s what Schrago did in their work, they just mixed both data sets and re-ran the analysis (or, more precisely, they used Kay’s data set as it was but added new genomic data collected over the last seven years to Opazo’s data set). Here’s their result:

Schrago.et.al~2006-Fig2
Schrago et al. 2013 Fig 2. Phylogeny of extant and extinct Platyrrhini using both molecular and morphological data.

So here we have the advantage of both methods combined and this tree is far more user friendly for macroevolutionary studies; one can test evolutionary hypothesis through time using a more complete representation of the Platyrrhini evolutionary history. One major problem still remains though; the paucity of useful morphological data compared to the wealth of molecular data which is now available. Does that influence the tree’s topology somehow? Well, stay tuned, my simulations are running…

Author: Thomas Guillerme, guillert[at]tcd.ie, @TGuillerme

Photo credit: wikimedia commons

The Placental mammal saga; special summer double episode

Flickr_-_ggallice_-_Rodent

As I wrote in a previous post last winter, O’Leary et al. added their oar into the Placental Mammal origins debate. For anyone who missed that episode, they argued, with the backing of masses of morphological data, that placental mammal orders appeared right after the extinction of non-avian dinosaurs (also known as the explosive model). This was in opposition to two other views based on DNA data which argue that placentals appeared way before (long-fuse model) or slightly before (short-fuse model) the Mexican dinosaurs had to deal with some meteorite… Again, have a look at this previous post criticizing O’Leary et al.’s paper and how they “forgot” to use (ignored?) state-of-the-art phylogenetic inference methods.

While I was away feeding mosquitoes in Finland – and wondering whether the lack of fishes for dinner was due to my poor fishing skills or the absence of fishes in the river – Science published two new episodes of the placental saga. Of the two, Springer et al. took the decision to properly criticize the methods of O’Leary et al.’s work. Amongst their detailed methods review, they particularly underlined the inaccuracy of O’Leary et al.’s explosive model; such a hypothesis would imply that the early placental mammals had a rate of molecular change similar to that of retroviruses. For over ten years it has been widely accepted that molecular rates (i.e. the number of DNA changes that are transmitted to descendants) vary among lineages through time. Knowing that, one can estimate these rates (or call it speed if you’re more comfortable with that) of evolution by calibrating phylogenetic trees with fossils. So, in this case, the amount of evolution needed to evolve from the late Cretaceous (~65 myr) non-placental mammals to the first placental mammals (~58 myr) has to be as high as evolutionary rates more characteristic of retroviruses to realistically explain this evolution.

Herein lies the eternal debate between palaeontologists and molecular biologists. The former base their estimations on the morphological changes they can see in the fossil record (even though some, as O’Leary et al. also include molecular data) while the latter calculate their evolutionary rate estimations on the molecular changes that they infer from living species’ DNA. Fundamentally, each method is valid but they are describing slightly different things ; palaeontologists infer the rates of changes between morphospecies (i.e. species that are separated based on their morphology) while molecular biologists study the rates of changes between surviving genetic pools (i.e. the populations leading to living species). My guess is that the true evolutionary history (i.e. the morphological and molecular changes of all the populations –fossils and living– through time) is to be found somewhere between these two approaches.

And that’s what I think O’Leary et al. demonstrated in their response to Springer et al.’s comments. Through a kind of a dodgy answer in reply to the technical points that Springer et al. underlined as the “retrovirusesomorph” rates, O’Leary’s team reran the analysis and found that yes, maybe the explosive model is not very realistic regarding the molecular data but neither is the long-fuse model regarding the palaeontological data. So which one should we choose? Hmmm, why not just go for the middle way with the short-fuse model? OK let’s do that – without calling it a short-fuse model though (they called it an “explosive model” in figure 2-B but to my mind at least, it’s getting closer to the short-fuse one).

So all that for what? Nobody can either deny O’Leary et al.’s amazing work nor claim that the long-fuse model is realistic; the consensual short-fuse model remains pretty well supported among both moderate palaeontologists and molecular biologists. However, I still cherish this paper because it shows how I think good science should always work; find the two extreme scenarios and then study the median one…

Author

Thomas Guillerme: guillert[at]tcd.ie

@TGuillerme

Photo credit

Wikimedia commons